New Semester
Started
Get
50% OFF
Study Help!
--h --m --s
Claim Now
Question Answers
Textbooks
Find textbooks, questions and answers
Oops, something went wrong!
Change your search query and then try again
S
Books
FREE
Study Help
Expert Questions
Accounting
General Management
Mathematics
Finance
Organizational Behaviour
Law
Physics
Operating System
Management Leadership
Sociology
Programming
Marketing
Database
Computer Network
Economics
Textbooks Solutions
Accounting
Managerial Accounting
Management Leadership
Cost Accounting
Statistics
Business Law
Corporate Finance
Finance
Economics
Auditing
Tutors
Online Tutors
Find a Tutor
Hire a Tutor
Become a Tutor
AI Tutor
AI Study Planner
NEW
Sell Books
Search
Search
Sign In
Register
study help
mathematics
statistics the art and science
Statistics Unlocking The Power Of Data 1st Edition Robin H. Lock, Patti Frazer Lock, Kari Lock Morgan, Eric F. Lock, Dennis F. Lock - Solutions
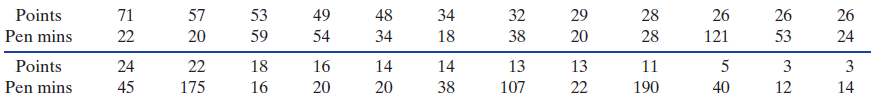
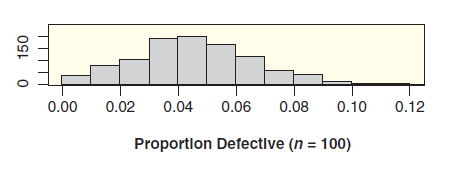
Exercise 3.86 describes data on the number of penalty minutes for Ottawa Senators NHL players. The sample has a fairly large standard deviation, s = 49.1 minutes. Use StatKey or other technology to create a bootstrap distribution, estimate the standard error, and give a 95% confidence interval for
Using the data to find a 99% confidence intervalA change in this process is described. If all else stays the same, which of the following confidence intervals (A, B, or C) is the most likely result after the change:A. 66 to 74 B. 67 to 73 C. 67.5 to 72.5
Using 1000 bootstrap samples for the distributionA change in this process is described. If all else stays the same, which of the following confidence intervals (A, B, or C) is the most likely result after the change:A. 66 to 74 B. 67 to 73 C. 67.5 to 72.5
Find a 95% confidence interval if 35 agree in a random sample of 100 people.Give information about the proportion of a sample that agree with a certain statement. Use StatKey or other technology to find a confidence interval at the given confidence level for the proportion of the population to
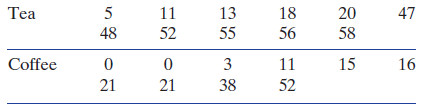
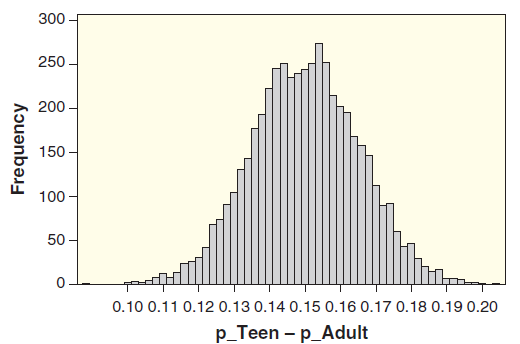
In Exercise 3.82, we introduce a study to estimate the difference in mean immune response (as measured in the study) between tea drinkers and coffee drinkers. The data are given in Table 3.12 on page 204 and are available in Immune Tea.Table 3.12(a) Give a point estimate for the difference in
Exercise 3.87 on page 205 asked you to use the standard error to construct a 95% confidence interval for the standard deviation of penalty minutes for NHL players.(a) Assuming the data in OttawaSenators can be viewed as a reasonable sample of all NHL players, use StatKey or other technology and
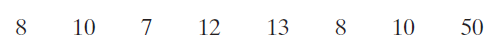
How many ants will climb on a piece of a peanut butter sandwich left on the ground near an ant hill? To study this, a student in Australia left a piece of a sandwich for several minutes, then covered it with a jar and counted the number of ants. He did this eight times, and the results are shown in
A type of small snail is very widespread in Japan, and colonies of the snails that are genetically similar have been found very far apart. Scientists wondered how the snails could travel such long distances. A recent study provides the answer. Biologist Shinichiro Wada fed 174 live snails to birds
In a random sample of 1000 people, 382 people agree, 578 disagree, and 40 are undecided.Give information about the proportion of a sample that agrees with a certain statement. Use StatKey or other technology to estimate the standard error from a bootstrap distribution generated from the sample.
In a random sample of 400 people, 112 agree and 288 disagree.Give information about the proportion of a sample that agrees with a certain statement. Use StatKey or other technology to estimate the standard error from a bootstrap distribution generated from the sample. Then use the standard error to
In a random sample of 100 people, 35 agree.Give information about the proportion of a sample that agrees with a certain statement. Use StatKey or other technology to estimate the standard error from a bootstrap distribution generated from the sample. Then use the standard error to give a 95%
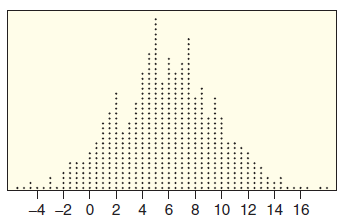
The bootstrap distribution in Figure 3.19(d), generated for a difference in sample means.Figure 3.19 d.Use the bootstrap distributions in Figure 3.19 to estimate the point estimate and standard error, and then use this information to give a 95% confidence interval. In addition, give notation for
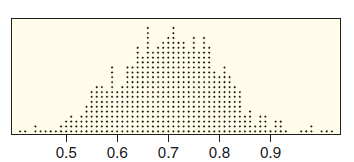
The bootstrap distribution in Figure 3.19(c), generated for a sample correlation.Figure 3.19 c.Use the bootstrap distributions in Figure 3.19 to estimate the point estimate and standard error, and then use this information to give a 95% confidence interval. In addition, give notation for the
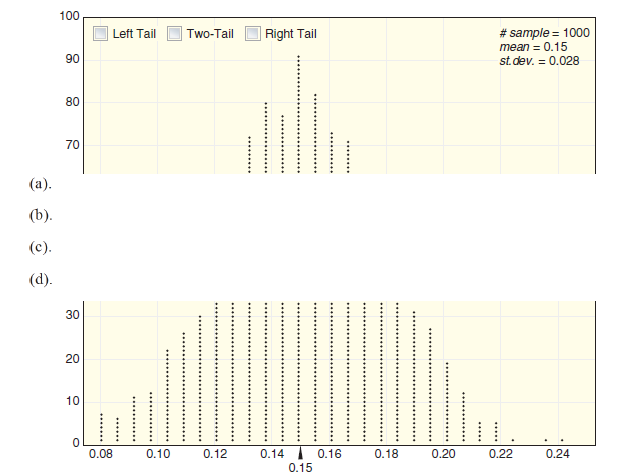
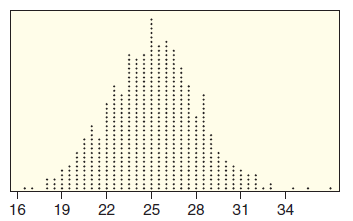
The bootstrap distribution in Figure 3.19(b), generated for a sample mean.Figure 3.19 bUse the bootstrap distributions in Figure 3.19 to estimate the point estimate and standard error, and then use this information to give a 95% confidence interval. In addition, give notation for the parameter
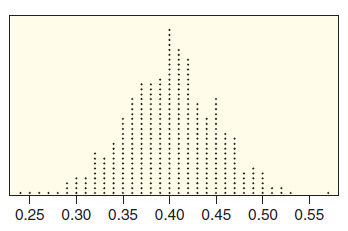
The bootstrap distribution in Figure 3.19(a), generated for a sample proportion.Figure 3.19 a.Use the bootstrap distributions in Figure 3.19 to estimate the point estimate and standard error, and then use this information to give a 95% confidence interval. In addition, give notation for the
Original sample: 85, 72, 79, 97, 88.Do the values given constitute a possible bootstrap sample from the original sample?(a) 79, 79, 97, 85, 88(b) 72, 79, 85, 88, 97(c) 85, 88, 97, 72(d) 88, 97, 81, 78, 85(e) 97, 85, 79, 85, 97(f) 72, 72, 79, 72, 79A sample is given. Indicate whether each option is
Original sample: 17, 10, 15, 21, 13, 18.Do the values given constitute a possible bootstrap sample from the original sample?(a) 10, 12, 17, 18, 20, 21(b) 10, 15, 17(c) 10, 13, 15, 17, 18, 21(d) 18, 13, 21, 17, 15, 13, 10(e) 13, 10, 21, 10, 18, 17A sample is given. Indicate whether each option is a
Suppose that a student is working on a statistics project using data on pulse rates collected from a random sample of 100 students from her college. She finds a 95% confidence interval for mean pulse rate to be (65.5, 71.8). Discuss how each of the statements below would indicate an improper
In the experiment described above under Fish Democracies, the schools of fish in the study with an opinionated minority and a less passionate majority picked the majority option only about 17% of the time. However, when groups also included 10 fish with no opinion, the schools of fish picked the
In a school of fish with a minority of strongly opinionated fish wanting to aim for the yellow mark and a majority of less passionate fish wanting to aim for the blue mark, as described under Fish Democracies above, a 95% confidence interval for the proportion of times the majority wins (they go to
Fish can be trained quite easily. With just seven days of training, golden shiner fish learn to pick a color (yellow or blue) to receive a treat, and the fish will swim to that color immediately. On the first day of training, however, it takes them some time. In the study described under Fish
Overeating for just four weeks can increase fat mass and weight over two years later, a Swedish study shows. Researchers recruited 18 healthy and normal-weight people with an average age of 26. For a four-week period, participants increased calorie intake by 70% (mostly by eating fast food) and
Throughout the US presidential election of 2012, polls gave regular updates on the sample proportion supporting each candidate and the margin of error for the estimates. This attempt to predict the outcome of an election is a common use of polls. In each case below, the proportion of voters who
Bisphenol A (BPA) is in the lining of most canned goods, and recent studies have shown a positive association between BPA exposure and behavior and health problems. How much does canned soup consumption increase urinary BPA concentration? That was the question addressed in a recent study in which
A new study provides some evidence that playing action video games strengthens a person’s ability to translate sensory information quickly into accurate decisions. Researchers had 23 male volunteers with an average age of 20 look at moving arrays on a computer screen and indicate the direction in
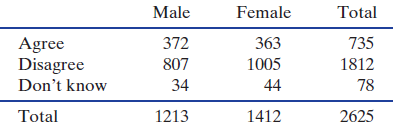
In Data 2.1 on page 46, we describe a study in which a random sample of 2625 US adults were asked whether they agree or disagree that there is €˜€˜only one true love for each person.€ The response and gender of the participants is shown in Table 3.6. Use the
In Data 2.1 on page 46, we describe a study in which a random sample of 2625 US adults were asked whether they agree or disagree that there is ‘‘only one true love for each person.” The study tells us that 735 of those polled said they agree with the statement. The standard error for this
A random sample of n = 755 US cell phone users age 18 and older in May 2011 found that the average number of text messages sent or received per day is 41.5 messages, with standard error about 6.1.(a) State the population and parameter of interest. Use the information from the sample to give the
A random sample of n = 1483 adults in the US were asked whether they consider a car a necessity or a luxury, and we find that a 95% confidence interval for the proportion saying that it is a necessity is 0.83 to 0.89. Explain the meaning of this confidence interval in the appropriate context.
A report from a Gallup poll in 2011 started by saying, ‘‘Forty-five percent of American adults reported getting their health insurance from an employer...” Later in the article we find information on the sampling method, ‘‘a random sample of 147,291 adults, aged 18 and over, living in the
According to a recent study of 7335 young people in the US, 30% had been arrested for a crime other than a traffic violation by the age of 23. Crimes included such things as vandalism, underage drinking, drunken driving, shoplifting, and drug possession.(a) Is the 30% a parameter or a statistic?
p̂1 − p̂2 = 0.08 and the margin of error for 95% confidence is ±3%.Information about a sample is given. Assuming that the sampling distribution is symmetric and bell-shaped, use the information to give a 95% confidence interval, and indicate the parameter being estimated.
x̅1 − x̅2 = 3.0 and the margin of error for 95% confidence is 1.2.Information about a sample is given. Assuming that the sampling distribution is symmetric and bell-shaped, use the information to give a 95% confidence interval, and indicate the parameter being estimated.
r = −0.46 and the margin of error for 95% confidence is 0.05.Information about a sample is given. Assuming that the sampling distribution is symmetric and bell-shaped, use the information to give a 95% confidence interval, and indicate the parameter being estimated.
r = 0.34 and the standard error is 0.02.Information about a sample is given. Assuming that the sampling distribution is symmetric and bell-shaped, use the information to give a 95% confidence interval, and indicate the parameter being estimated.
x̅ = 55 and the standard error is 1.5.Information about a sample is given. Assuming that the sampling distribution is symmetric and bell-shaped, use the information to give a 95% confidence interval, and indicate the parameter being estimated.
p̂ = 0.32 and the standard error is 0.04.Information about a sample is given. Assuming that the sampling distribution is symmetric and bell-shaped, use the information to give a 95% confidence interval, and indicate the parameter being estimated.
A 95% confidence interval for a proportion is 0.72 to 0.79. Is the value given a plausible value of p?(a) p = 0.85(b) p = 0.75(c) p = 0.07A 95% confidence interval is given, followed by possible values of the population parameter. Indicate which of the values are plausible values for the parameter
A 95% confidence interval for a mean is 112.1 to 128.2. Is the value given a plausible value of μ?(a) μ = 121(b) μ = 113.4(c) μ = 105.3A 95% confidence interval is given, followed by possible values of the population parameter. Indicate which of the values are plausible values for the parameter
For μ1 − μ2, using x̅1 − x̅2 = 5 with margin of error 8.Construct an interval estimate for the given parameter using the given sample statistic and margin of error.
For ρ, using r = 0.62 with margin of error 0.05.Construct an interval estimate for the given parameter using the given sample statistic and margin of error.
For p, using p̂ = 0.37 with margin of error 0.02.Construct an interval estimate for the given parameter using the given sample statistic and margin of error.
For μ, using x̅ = 25 with margin of error 3.Construct an interval estimate for the given parameter using the given sample statistic and margin of error.
Exercise 3.36 tells us that 181 of the 273 inductees to the Rock and Roll Hall of Fame have been performers. The data are given in Rock and Roll. Using all inductees as your population:(a) Use StatKey or other technology to take many random samples of size n = 10 and compute the sample proportion
Exercise 3.35 tells us that 41 of the 273 inductees to the Rock and Roll Hall of Fame have been female or have included female members. The data are given in Rock and Roll. Using all inductees as your population:(a) Use StatKey or other technology to take many random samples of size n = 10 and
From its founding through 2012, the Rock and Roll Hall of Fame has inducted 273 groups or individuals, and 181 of the inductees have been performers while the rest have been related to the world of music in some way other than as a performer. The full dataset is available in Rock and Roll.(a) What
Use StatKey or other technology to generate a sampling distribution of sample means using a sample size of n = 10 from the population of all times to finish the 2008 Olympic Men’s Marathon, available in the Minutes column of the file Olympic Marathon. What are the smallest and largest sample
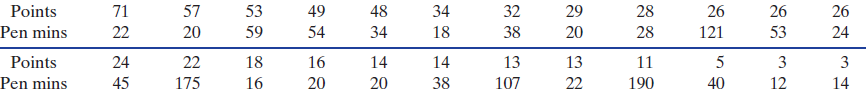
Use StatKey or other technology to generate a sampling distribution of sample means using a sample size of n = 5 from the Points values in Table 3.4 on page 174, which gives the number of points for all 24 players on the Ottawa Senators NHL hockey team, also available in the dataset Ottawa
In the 2008 Olympic Men’s Marathon, 76 athletes finished the race. Their times are stored in the file Olympic Marathon. Use the times stored in the Minutes column.(a) Use StatKey, other technology, or a random number table to randomly select 10 values. Indicate which values you’ve selected and
Table 3.4 on page 174 gives the number of points for all 24 players on the Ottawa Senators NHL hockey team, also available in the dataset Ottawa Senators.Table 3.4(a) Use StatKey, other technology, or a random number table to select a random sample of 5 of the 24 Points values. Indicate which
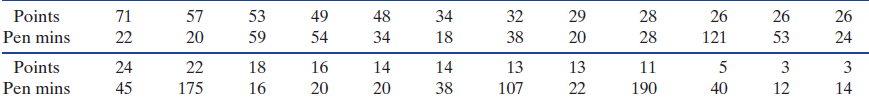
A company that sells boxes of screws claims that a box of its screws contains on average 50 screws (μ = 50). Figure 3.10 shows a distribution of sample means collected from many simulated random samples of size 10 boxes.Figure 3.10(a) For a random sample of 10 boxes, is it unlikely
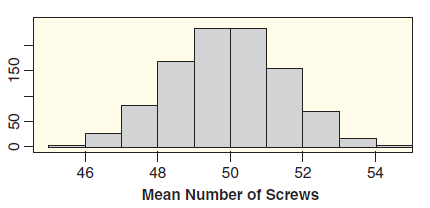
Suppose that 5% of the screws a company sells are defective. Figure 3.9 shows sample proportions from two sampling distributions:One shows samples of size 100, and the other shows samples of size 1000.Figure 3.9(a) What is the center of both distributions?(b) What is the approximate minimum and
Data 2.7 on page 93 introduces the dataset HollywoodMovies2011, which contains information on all the 136 movies that came out of Hollywood in 2011. One of the variables is the budget (in millions of dollars) to make the movie. Figure 3.8 shows two boxplots. One represents the budget data for one
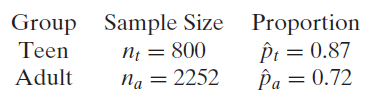
A study of n = 2252 adults age 18 or older found that 72% of the cell phone users send and receive text messages. A study of n = 800 teens age 12 to 17 found that 87% of the teen cell phone users send and receive text messages. What is the best estimate for the difference in the proportion of cell
In preparing for a test on a set of material, is it better to study one topic at a time or to study topics mixed together? In one study, a sample of fourth graders were taught four equations. Half of the children learned by studying repeated examples of one equation at a time, while the other half
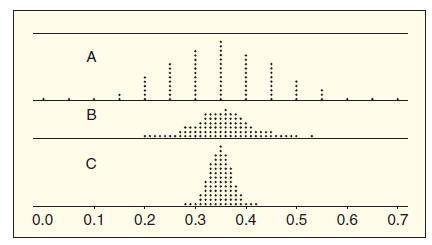
The US Census indicates that 35% of US residents are less than 25 years old. Figure 3.7 shows possible sampling distributions for the proportion of a sample less than 25 years old, for samples of size n = 20, n = 100, and n = 500.Figure 3.7(a) Which distribution goes with which sample size?(b) If
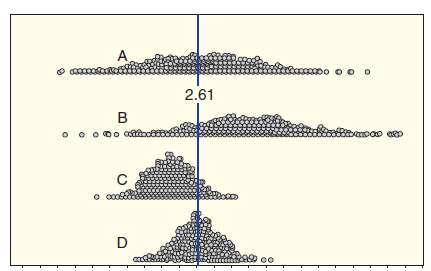
The latest US Census lists the average household size for all households in the US as 2.61. (A household is all people occupying a housing unit as their primary place of residence.) Figure 3.6 shows possible distributions of means for 1000 samples of household sizes. The scale on the horizontal
The use of topical painkiller ointment or gel rather than pills for pain relief was approved just within the last few years in the US for prescription use only. Insurance records show that the average copayment for a month’s supply of topical painkiller ointment for regular users is $30. A sample
Florida has over 7700 lakes. We wish to estimate the correlation between the pH levels of all Florida lakes and the mercury levels of fish in the lakes. We see in Data 2.4 on page 68 that the correlation between these two variables for a sample of n = 53 of the lakes is −0.575.(a) Give notation
A survey conducted in May of 2010 asked 2252 adults in the US ‘‘Do you own a laptop computer?” The number saying yes was 1238. What is the best estimate for the proportion of US adults owning a laptop computer? Give notation for the quantity we are estimating, notation for the quantity we are
A random sample of n = 1675 Internet users in the US in January 2010 found that 469 of them have customized their web browser’s home page to include news from sources and on topics that particularly interest them. State the population and parameter of interest. Use the information from the sample
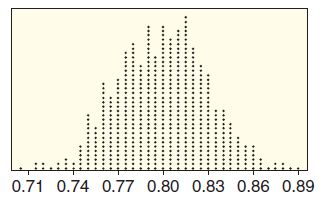
Using the sampling distribution shown in Figure 3.5(d), how likely are these sample proportions:Figure 3.5 d.(a) p̂ = 0.72(b) p̂ = 0.88(c) p̂ = 0.95Refer to the sampling distributions given in Figure 3.5. Several possible values are given for a sample
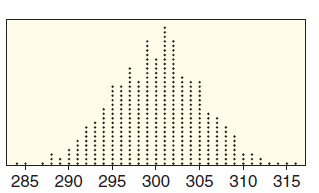
Using the sampling distribution shown in Figure 3.5(c), how likely are these sample means:Figure 3.5c.(a) xÌ… = 250(b) xÌ… = 305(c) xÌ… = 315Refer to the sampling distributions given in Figure 3.5. Several possible values are given for a sample statistic. In each
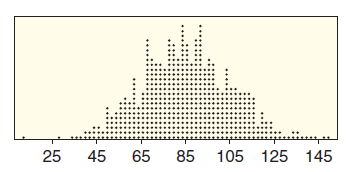
Using the sampling distribution shown in Figure 3.5(b), how likely are these sample means:Figure 3.5b.(a) xÌ… = 70(b) xÌ… = 100(c) xÌ… = 140Refer to the sampling distributions given in Figure 3.5. Several possible values are given for a sample statistic. In each
Saab, a Swedish car manufacturer, is interested in estimating average monthly sales in the US, using the following sales figures from a sample of five months:658, 456, 830, 696, 385Use StatKey or other technology to construct a bootstrap
A sample of prices of skateboards for sale online is shown in Table 3.11 and is available in the dataset Skateboard Prices.Table 3.11(a) What are the mean and standard deviation of the 20 skateboard prices?(b) Describe how to use the data to select one bootstrap sample. What statistic is recorded
The phrase ‘‘You dirty rat” does rats a disservice. In a recent study, rats showed compassion that surprised scientists. Twenty-three of the 30 rats in the study freed another trapped rat in their cage, even when chocolate served as a distraction and even when the rats would then have to
Exercise 3.79 describes a study in which rats showed compassion by freeing a trapped rat. In the study, all six of the six female rats showed compassion by freeing the trapped rat while 17 of the 24 male rats did so. Use the results of this study to give a point estimate for the difference in
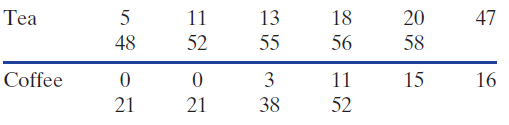
Exercise 3.27 on page 176 compares studies which measure the proportions of adult and teen cell phone users that send/receive text messages. The summary statistics are repeated below:Figure 3.21 shows a distribution for the differences in sample proportions (pÌ‚t ˆ’
Researchers suspect that drinking tea might enhance the production of interferon gamma, a molecule that helps the immune system fight bacteria, viruses, and tumors. A recent study involved 21 healthy people who did not normally drink tea or coffee. Eleven of the participants were randomly assigned
Exercise 2.144 on page 102 introduces the dataset Traffic Flow, which gives delay time in seconds for 24 simulation runs in Dresden, Germany, comparing the current timed traffic light system on each run to a proposed flexible traffic light system in which lights communicate traffic flow information
In addition to the commute time (in minutes), the Commute Atlanta dataset gives the distance for the commutes (in miles) for 500 workers sampled from the Atlanta metropolitan area.(a) Find the mean and standard deviation of the commute distances in Commute Atlanta.(b) Use StatKey or other
The data in CommuteAtlanta contains information on both the Distance (in miles) and Time (in minutes) for a sample of 500 Atlanta commutes. We expect the correlation between these two variables to be positive, since longer distances tend to take more time.(a) Find the correlation between Distance
To create a confidence interval from a bootstrap distribution using percentiles, we keep the middle values and chop off a certain percent from each tail. Indicate what percent of values must be chopped off from each tail for each confidence level given.(a) 95%(b) 90%(c) 98%(d) 99%
Using an original sample of size n = 45A change in this process is described. If all else stays the same, which of the following confidence intervals (A, B, or C) is the most likely result after the change:A. 66 to 74 B. 67 to 73 C. 67.5 to 72.5
Using an original sample of size n = 16A change in this process is described. If all else stays the same, which of the following confidence intervals (A, B, or C) is the most likely result after the change:A. 66 to 74 B. 67 to 73 C. 67.5 to 72.5
Using 10,000 bootstrap samples for the distributionA change in this process is described. If all else stays the same, which of the following confidence intervals (A, B, or C) is the most likely result after the change:A. 66 to 74 B. 67 to 73 C. 67.5 to 72.5
Find a 95% confidence interval if 180 agree in a random sample of 250 people.Give information about the proportion of a sample that agree with a certain statement. Use StatKey or other technology to find a confidence interval at the given confidence level for the proportion of the population to
Find a 90% confidence interval if 112 agree and 288 disagree in a random sample of 400 people.Give information about the proportion of a sample that agree with a certain statement. Use StatKey or other technology to find a confidence interval at the given confidence level for the proportion of the
Find a 99% confidence interval if, in a random sample of 1000 people, 382 agree, 578 disagree, and 40 can’t decide.Give information about the proportion of a sample that agree with a certain statement. Use StatKey or other technology to find a confidence interval at the given confidence level for
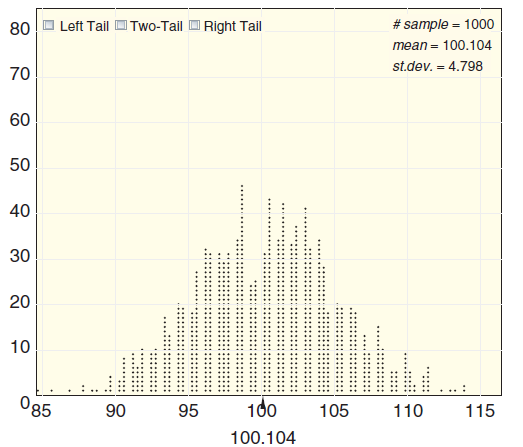
A sample of 10 IQ scores was used to create the bootstrap distribution of sample means inFigure 3.30.(a) Estimate the mean of the original sample of IQ scores.(b) The distribution was created using 1000 bootstrap statistics. Use the distribution to estimate a 99% confidence interval for the mean IQ
In Exercise 3.86 on page 204, we construct an interval estimate for mean penalty minutes given to NHL players in a season using data from players on the Ottawa Senators as our sample. Some percentiles from a bootstrap distribution of 1000 sample means are shown below. Use this information to find
In a recent poll of 1000 American adults, the number saying that exercise is an important part of daily life was 753. Use StatKey or other technology to find and interpret a 90% confidence interval for the proportion of American adults who think exercise is an important part of daily life.
Across nine European countries in a large-scale survey, people had a hard time identifying signs of a stroke or heart attack. The survey included 10,228 inhabitants of Austria, France, Germany, Italy, the Netherlands, Poland, Russia, Spain, and the United Kingdom. Participants ages ranged from 14
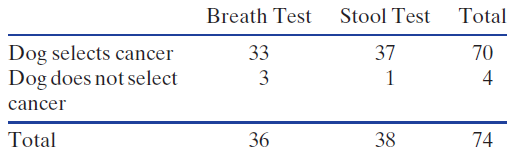
Exercise 2.17 on page 55 describes a study in which scientists train dogs to smell cancer. Researchers collected breath and stool samples from patients with cancer as well as from healthy people. A trained dog was given five samples, randomly displayed, in each test, one from a patient with cancer
Data 2.12 on page 119 describes information from a sample of 157 restaurant bills collected at the First Crush bistro. The data is available in RestaurantTips. Create a bootstrap distribution using this data and find and interpret a 95% confidence interval for the average tip left at this
Data 2.12 on page 119 describes information from a sample of 157 restaurant bills collected at the First Crush bistro. The data is available in RestaurantTips. Two intervals are given below for the average tip left at a restaurant; one is a 90% confidence interval and one is a 99% confidence
Data 1.1 on page 4 includes lots of information on a sample of 362 college students. The complete dataset is available at StudentSurvey. We see that 27 of the 193 males in the sample smoke while 16 of the 169 females in the sample smoke.(a) What is the best point estimate for the difference in the
Is there a home field advantage in soccer? We are specifically interested in the Football Association (FA) premier league, a football (soccer) league in Great Britain known for having especially passionate fans. We took a sample of 120 matches (excluding all ties) and found that the home team was
Table 3.15 shows land area (in 1000 sq km) and percent living in rural areas for a random sample of 10 countries selected from the AllCountries dataset. The data for this sample is stored in TenCountries. Use StatKey or other technology and this sample to find and interpret a 99% confidence
Table 3.15 shows land area (in 1000 sq km) and percent living in rural areas for a random sample of 10 countries from the AllCountries dataset that are stored in TenCountries.Table 3.15(a) Using the data in the sample, find the slope of the regression line to predict the percent of the population
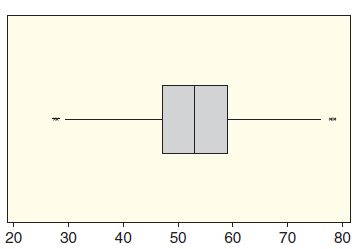
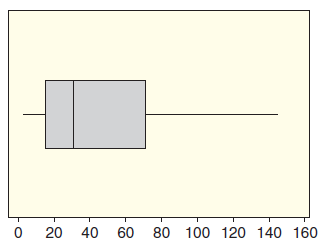
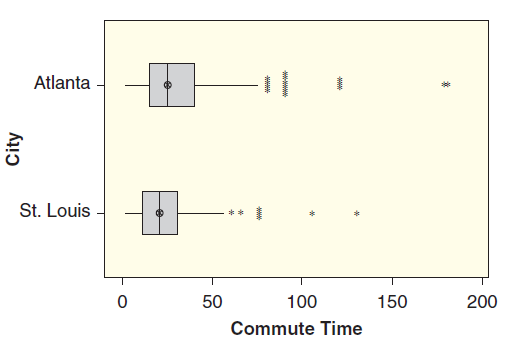
The datafile CommuteAtlanta contains a sample of commute times for 500 workers in the Atlanta area as described in Data 3.3 on page 193. The data in CommuteStLouis has similar information on the commuting habits of a random sample of 500 residents from metropolitan St. Louis. Figure 3.31 shows
As we have seen, bootstrap distributions are generally symmetric and bell-shaped and centered at the value of the original sample statistic. However, strange things can happen when the sample size is small and there is an outlier present. Use StatKey or other technology to create a bootstrap
In Exercise 3.60 on page 191, we describe a study in which participants ate significantly more and exercised significantly less for a month. Two and half years later, participants weighed an average of 6.8 pounds more than at the start of the experiment (while the weights of a control group had not
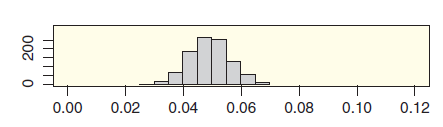
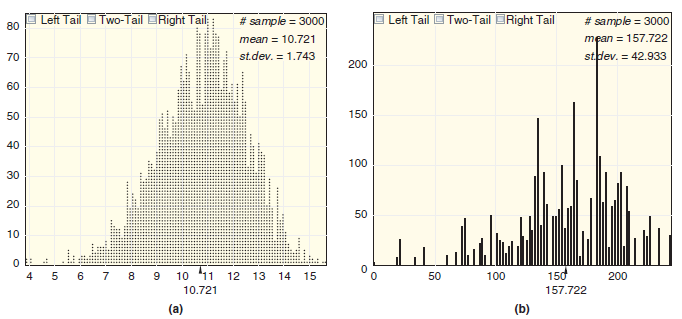
Figure 3.32 shows bootstrap distributions for the standard deviation of two different datasets. In each case, if appropriate, use the bootstrap distribution to estimate and interpret a 95% confidence interval for the population standard deviation. If not appropriate, explain why not.Figure 3.32(a)
To create a confidence interval from a bootstrap distribution using percentiles, we keep the middle values and chop off some number of the lowest values and the highest values. If our bootstrap distribution contains values for 1000 bootstrap samples, indicate how many we chop off at each end for
Using the data to find a 90% confidence intervalA change in this process is described. If all else stays the same, which of the following confidence intervals (A, B, or C) is the most likely result after the change:A. 66 to 74 B. 67 to 73 C. 67.5 to 72.5
For the dataset 45, 46, 48, 49, 49, 50, 50, 52, 52, 54, 57, 57, 58, 58, 60, 61.(a) Without doing any calculations, estimate which of the following numbers is closest to the mean:60, 53, 47, 58(b) Without doing any calculations, estimate which of the
Indicate whether the five number summary corresponds most likely to a distribution that is skewed to the left, skewed to the right, or symmetric.(100, 110, 115, 160, 220)
Indicate whether the five number summary corresponds most likely to a distribution that is skewed to the left, skewed to the right, or symmetric.(0, 15, 22, 24, 27)
Showing 1300 - 1400
of 2108
First
7
8
9
10
11
12
13
14
15
16
17
18
19
20
21
Last
Step by Step Answers