New Semester
Started
Get
50% OFF
Study Help!
--h --m --s
Claim Now
Question Answers
Textbooks
Find textbooks, questions and answers
Oops, something went wrong!
Change your search query and then try again
S
Books
FREE
Study Help
Expert Questions
Accounting
General Management
Mathematics
Finance
Organizational Behaviour
Law
Physics
Operating System
Management Leadership
Sociology
Programming
Marketing
Database
Computer Network
Economics
Textbooks Solutions
Accounting
Managerial Accounting
Management Leadership
Cost Accounting
Statistics
Business Law
Corporate Finance
Finance
Economics
Auditing
Tutors
Online Tutors
Find a Tutor
Hire a Tutor
Become a Tutor
AI Tutor
AI Study Planner
NEW
Sell Books
Search
Search
Sign In
Register
study help
mathematics
statistics the art and science
Statistics Unlocking The Power Of Data 1st Edition Robin H. Lock, Patti Frazer Lock, Kari Lock Morgan, Eric F. Lock, Dennis F. Lock - Solutions
Hypotheses: H0: μ1 = μ2 vs Ha: μ1 ≠ μ2. In addition, in each case for which the results are significant, state which group (1 or 2) has the larger mean.(a) 95% confidence interval for μ1 − μ2: 0.12 to 0.54(b) 99% confidence interval for μ1 − μ2:−2.1 to 5.4(c) 90% confidence
A 99% confidence interval for μ: 134 to 161(a) H0: μ = 100 vs Ha: μ ≠ 100(b) H0: μ = 150 vs Ha: μ ≠ 150(c) H0: μ = 200 vs Ha: μ ≠ 200A confidence interval for a sample is given, followed by several hypotheses to test using that sample. In each case, use the confidence interval to give
A 90% confidence interval for p1 − p2: 0.07 to 0.18(a) H0: p1 = p2 vs Ha: p1 ≠ p2(b) H0: p1 = p2 vs Ha: p1 > p2(c) H0: p1 = p2 vs Ha: p1 < p2A confidence interval for a sample is given, followed by several hypotheses to test using that sample. In each case, use the confidence interval to
In a Gallup poll conducted in August 2010, a random sample of n = 1013 American adults were asked ‘‘Do you approve or disapprove of the way Congress is handling its job?” The proportion who said they approve is p̂ = 0.19, and a 95% confidence interval for Congressional job approval is 0.166
A new study suggests that exposure to UV rays through the car window may increase the risk of skin cancer. The study reviewed the records of all 1050 skin cancer patients referred to the St. Louis University Cancer Center in 2004. Of the 42 patients with melanoma, the cancer occurred on the left
Suppose you want to find out if reading speed is any different between a print book and an e-book.(a) Clearly describe how you might set up an experiment to test this. Give details.(b) Why is a hypothesis test valuable here? What additional information does a hypothesis test give us beyond the
A new study shows that relationship status on Facebook matters to couples. The study included 58 college-age heterosexual couples who had been in a relationship for an average of 19 months. In 45 of the 58 couples, both partners reported being in a relationship on Facebook. In 31 of the 58 couples,
In Exercise 3.108 on page 215, we see that the home team was victorious in 70 games out of a sample of 120 games in the FA premier league, a football (soccer) league in Great Britain. We wish to investigate the proportion p of all games won by the home team in this league.(a) Use StatKey or other
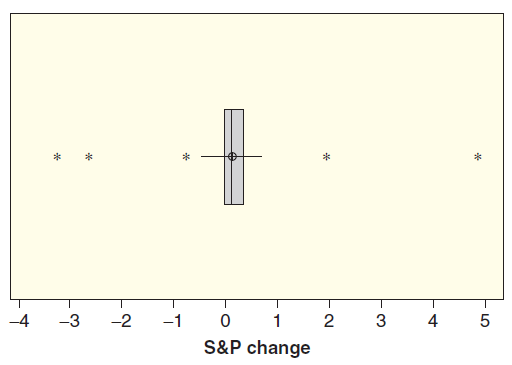
Standard & Poor€™s maintains one of the most widely followed indices of large-cap American stocks: the S&P 500. The index includes stocks of 500 companies in industries in the US economy. A random sample of 50 of these companies was selected, and the change in the price of the
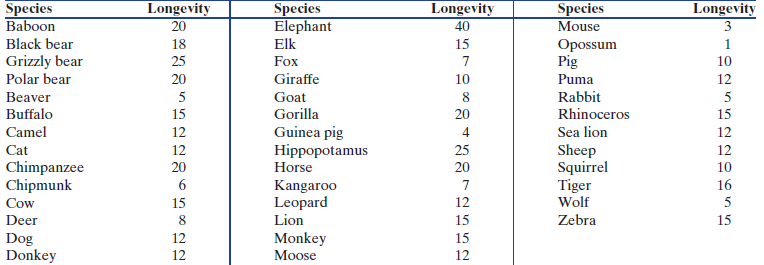
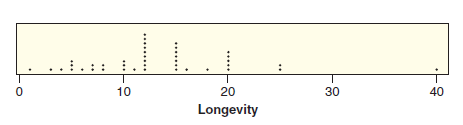
Data 2.2 on page 61 includes information on longevity (typical lifespan), in years, for 40 species of mammals.(a) Use the data, available in MammalLongevity, and StatKey or other technology to test to see if the average lifespan of mammal species is different from 10 years. Include all details of
Data 2.2 on page 61 includes information on length of gestation (length of pregnancy in days) for 40 species of mammals.(a) Use the data, available in MammalLongevity, and StatKey or other technology to test to see if the average gestation of mammals is different from 200 days. Include all details
Suppose that a weight loss company advertises that people using its program lose an average of 8 pounds the first month and that the Federal Trade Commission (the main government agency responsible for truth in advertising) is gathering evidence to see if this advertising claim is accurate. If the
Exercise 4.163 introduces a study in which half of the kindergarten classes in a school district are randomly assigned to receive iPads. We learn that the results are significant at the 5% level (the mean for the iPad group is significantly higher than for the control group) for the results on the
The FDA (US Food and Drug Administration) is responsible for approving all new drugs sold in the US. In order to approve a new drug for use as an antidepressant, the FDA requires two results from randomized double-blind experiments showing the drug is more effective than a placebo at a 5% level.
In Exercise 4.132 on page 279, we learn that massage helps reduce levels of the inflammatory cytokine interleukin-6 in muscles when muscle tissue is tested 2.5 hours after massage. The results were significant at the 5% level. However, the authors of the study actually performed 42 different tests:
A recent article noted that it may be possible to accurately predict which way a penalty-shot kicker in soccer will direct his shot. The study finds that certain types of body language by a soccer player—called ‘‘tells”—can be accurately read to predict whether the ball will go left or
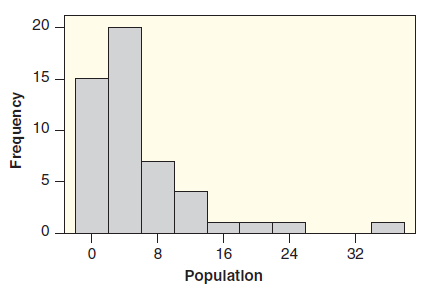
The dataset USStates has a great deal of information about the 50 states, including population. Figure 2.13 shows a histogram of the population, in millions, of the 50 states in the US.Figure 2.13(a) Do these values represent a population or a sample?(b) Describe the shape of the distribution: Is
Use technology to find the following values:25, 72, 77, 31, 80, 80, 64, 39, 75, 58, 43, 67, 54, 71, 60(a) The mean and the standard deviation.(b) The five number summary.
Indicate whether the five number summary corresponds most likely to a distribution that is skewed to the left, skewed to the right, or symmetric.(15, 25, 30, 35, 45)
Indicate whether the five number summary corresponds most likely to a distribution that is skewed to the left, skewed to the right, or symmetric.(22.4, 30.1, 36.3, 42.5, 50.7)
Mean 3 and standard deviation 1.Sketch a curve showing a distribution that is symmetric and bell-shaped and has approximately the given mean and standard deviation. In each case, draw the curve on a horizontal axis with scale 0 to 10.
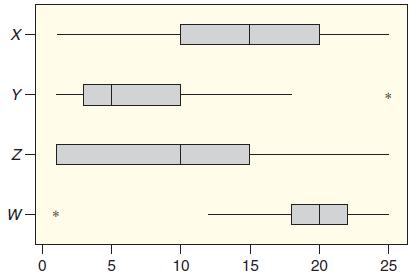
Match each five number summary with one of the boxplots inFigure 2.38.(a) (1, 18, 20, 22, 25)(b) (1, 10, 15, 20, 25)(c) (1, 3, 5, 10, 25)(d) (1, 1, 10, 15, 25)Match the five number summaries with the boxplots. х- Y. z- W- 10 15 20 25
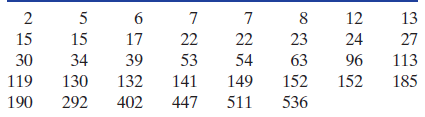
Table 2.28 gives data showing the time to infection, at the point of insertion of the catheter, for kidney patients using portable dialysis equipment. There are 38 patients, and the data give the first observation for each patient. The five number summary for these data is (2, 15, 46, 149,
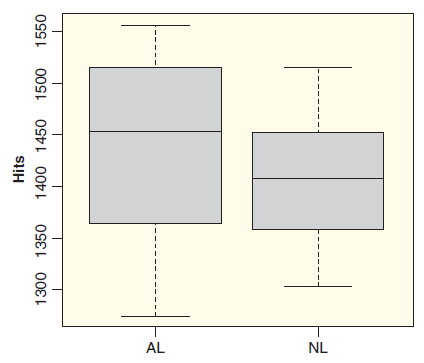
Major League Baseball is split into two leagues, the National League (NL) and the American League (AL). The main difference between the two leagues is that pitchers take at bats in the National League but not in the American League. Are total team hits different between the two leagues? Figure 2.42
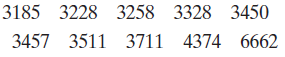
The five number summary for daily calorie consumption is (445, 1334, 1667, 2106, 6662).(a) The 10 largest data values are given below. Which (if any) of these is an outlier?(b) Determine whether there are any low outliers. Show your work.(c) Draw the boxplot for the calorie data.Use data from
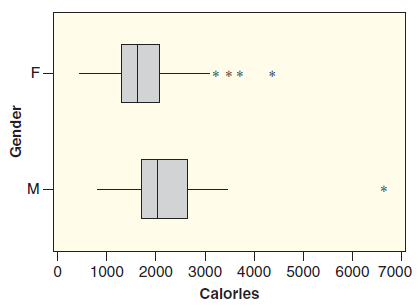
Figure 2.43 shows side-by-side boxplots comparing calorie consumption by gender.Figure 2.43(a) Which gender has the largest median daily calorie consumption? Which gender has the largest outlier? Which gender has the most outliers?(b) Does there seem to be an association between gender and calorie
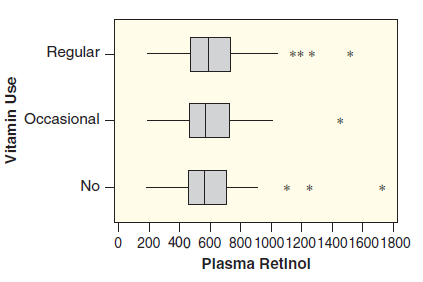
Figure 2.44 displays the relationship between vitamin use and the concentration of retinol (a micronutrient) in the blood. Does there seem to be an association between these two variables?Figure 2.44Use data from Nutrition-Study on dietary variables and concentrations of micronutrients in the blood
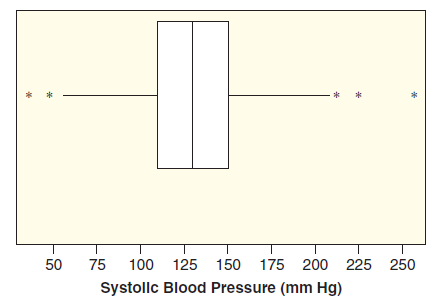
Figure 2.45 shows the boxplot for the systolic blood pressures for all 200 patients in the ICU study in ICUAdmissions. Discuss what information this graph gives about the distribution of blood pressures in this sample of patients. What is the five number summary?Figure 2.45 50 75 100 125 150 175
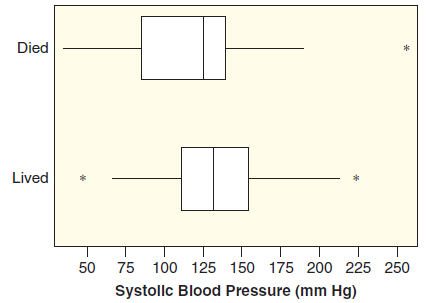
The data in ICU Admissions contains a categorical variable Status indicating whether each patient lived (0) or died (1). Is there a relationship between the status (lived/died) and the systolic blood pressures? Use the side-by-side boxplots showing the systolic blood pressures for these two groups
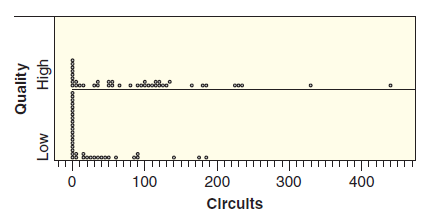
When honeybees are looking for a new home, they send out scouts to explore options. When a scout returns, she does a €˜€˜waggle dance€ with multiple circuit repetitions to tell the swarm about the option she found. The bees then decide between the options and pick the
In a study to determine how the calcium level of water affects respiration rate of fish, 360 fish in a sample were randomly divided into three tanks with different levels of calcium: low, medium, and high. The respiration rate of the fish, in beats per minute, was then measured. The dataset is in
Have you ever driven along a street where it seems that every traffic light is red when you get there? Some engineers in Dresden, Germany, are looking at ways to improve traffic flow by enabling traffic lights to communicate information about traffic flow with nearby traffic lights. The data in
One dataset has median 25, interquartile range 20, and range 30. The other dataset has median 75, interquartile range 20, and range 30.Examine issues of location and spread for boxplots. In each case, draw sideby- side boxplots of the datasets on the same scale. There are many possible answers.
One dataset has median 50, interquartile range 20, and range 40.Asecond dataset has median 50, interquartile range 50, and range 100. A third dataset has median 50, interquartile range 50, and range 60.Examine issues of location and spread for boxplots. In each case, draw sideby- side boxplots of
Distance driven since the last fill-up of the gas tank and Amount of gas left in the tank.Two quantitative variables are described. Do you expect a positive or negative association between the two variables? Explain your choice.
Outside temperature and Amount of clothes worn.Two quantitative variables are described. Do you expect a positive or negative association between the two variables? Explain your choice.
Number of people in a square mile and Number of trees in the square mile.Two quantitative variables are described. Do you expect a positive or negative association between the two variables? Explain your choice.
Amount of time spent studying and Grade on the exam.Two quantitative variables are described. Do you expect a positive or negative association between the two variables? Explain your choice.
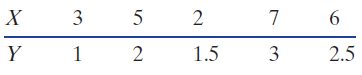
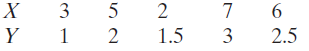
Make a scatterplot of the data. Put the X variable on the horizontal axis and the Y variable on the vertical axis. 3 5 2 6. 1.5 3 2.5 2.
Use statistical software on a computer or calculator to find the correlation for the data indicated.The data in Exercise 2.163 3 5 2 6. 1.5 3 2.5 2.
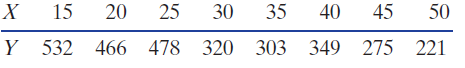
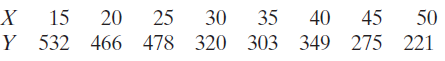
Use statistical software on a computer or calculator to find the correlation for the data indicated.The data in Exercise 2.164 15 50 25 30 35 40 45 303 349 275 221 |Y 532 466 478 320
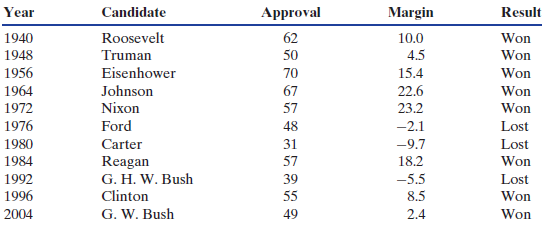
In Data 2.9 on page 103, we discuss the relationship between a president€™s approval rating when running for re-election and the margin of victory or defeat in the election. Table 2.29 shows the data and Figure 2.48 shows a scatterplot of the data.Table 2.29(a) In how many of the 11
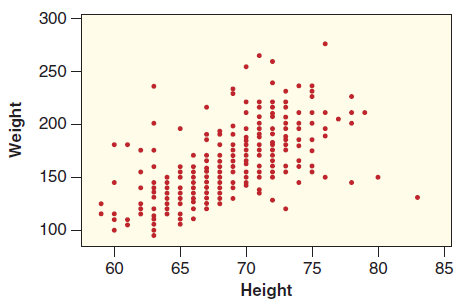
The quantitative variables Height (in inches) and Weight (in pounds) are included in the StudentSurvey dataset.(a) What would a positive association mean for these two variables? What would a negative association mean? Which do you expect is more likely?(b) Figure 2.56 shows a scatterplot of the
A somewhat surprising fact about coffee is that the longer it is roasted, the less caffeine it has. Thus an ‘‘extra bold” dark roast coffee actually has less caffeine than a light roast coffee. What is the explanatory variable and what is the response variable? Do the two variables have a
Multiple studies in both animals and humans show the importance of a mother’s love (or the unconditional love of any close person to a child) in a child’s brain development. A recent study shows that children with nurturing mothers had a substantially larger area of the brain called the
In earlier studies, scientists reported finding a ‘‘commitment gene” in men, in which men with a certain gene variant were much less likely to commit to a monogamous relationship. That study involved only men (and we return to it later in this text), but a new study, involving birds this time
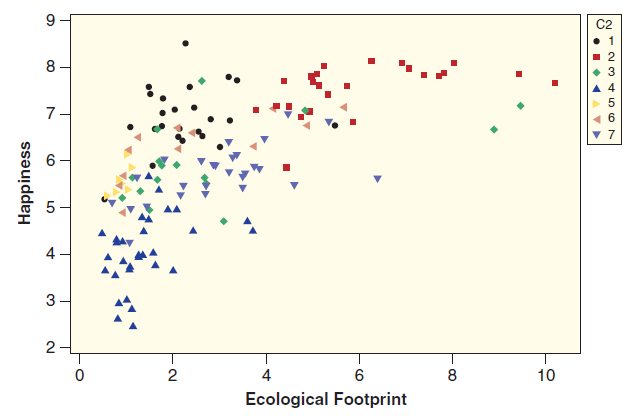
The website TED.com offers free short presentations, called TED Talks, on a variety of interesting subjects. One of the talks is called €˜€˜The Happy Planet Index,€ by Nic Marks. Marks comments that we regularly measure and report economic data on countries, such as
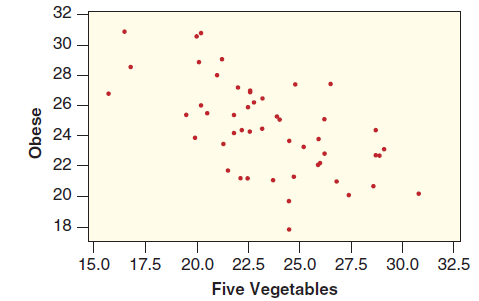
The USStates dataset includes information on the 50 US states, including the percent of the population of each state that eats at least five servings of fruits and vegetables a day and the percent of the population of each state that is obese. Figure 2.58 shows a scatterplot of these two
Suppose we record the husband’s age and the wife’s age for many randomly selected couples.(a) What would it mean about ages of couples if these two variables had a negative relationship?(b) What would it mean about ages of couples if these two variables had a positive relationship?(c) Which do
A closed body posture includes sitting hunched over or standing with arms crossed rather than sitting or standing up straight and having the arms more open. According to a recent study, people who were rated as having a more closed body posture ‘‘had higher levels of stress hormones and said
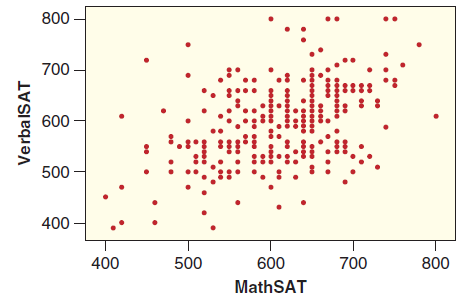
The StudentSurvey dataset includes scores on the Math and Verbal portions of the SAT exam.(a) What would a positive relationship between these two variables imply about SAT scores? What would a negative relationship imply?(b) Figure 2.59 shows a scatterplot of these two variables. For each corner
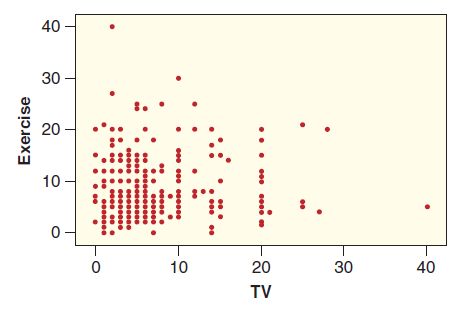
The StudentSurvey dataset includes information on the number of hours a week students say they exercise and the number of hours a week students say they watch television.(a) What would a positive relationship between these two variables imply about the way students spend their time? What would a
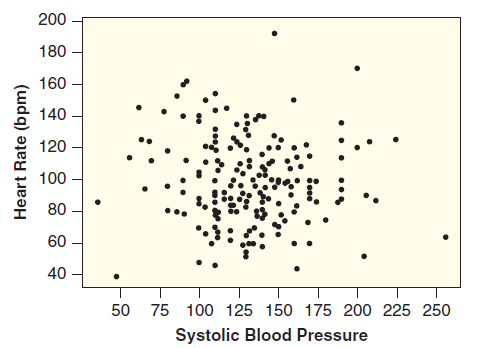
In Example 2.19 on page 79 we computed z-scores for patient #772 in the ICU Admissions dataset, who had a high systolic blood pressure reading of 204 but a low pulse rate of 52 bpm.(a) Find the point corresponding to patient #772 on the scatterplot of blood pressure vs heart rate shown inFigure
Table 2.32 gives the times for five races in which two joggers participated.Table 2.32Jogger A.........................Jogger B44
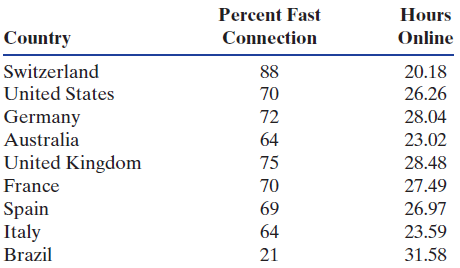
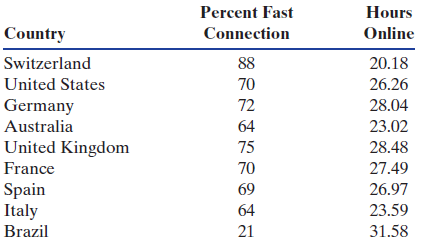
In Exercise 2.109 on page 89, we discuss a study in which the Nielsen Company measured connection speeds on home computers in nine different countries in order to determine whether connection speed affects the amount of time consumers spend online. Table 2.33 shows the percent of Internet users
A researcher claims to have evidence of a strong positive correlation (r = 0.88) between a person’s blood alcohol content (BAC) and the type of alcoholic drink consumed (beer, wine, or hard liquor). Explain, statistically, why this claim makes no sense.
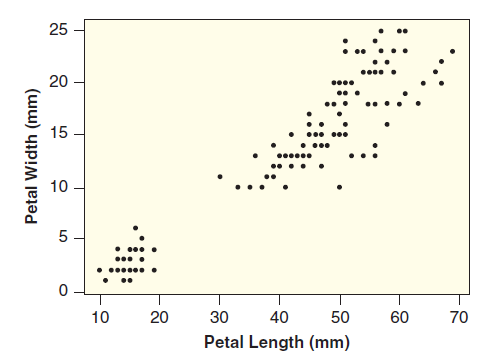
Allometry is the area of biology that studies how different parts of a body grow in relation to other parts. Figure 2.62 shows a scatterplot comparing the length and width of petals of irises.Figure 2.62(a) Does there appear to be a positive or negative association between petal width and petal
Draw any scatterplot satisfying the following conditions:(a) n = 10 and r = 1(b) n = 8 and r = −1(c) n = 5 and r = 0
The dataset NBAPlayers2011 is introduced on page 88, and includes many variables about players in the National Basketball Association in 2010–2011.(a) Use technology to create a scatterplot for the relationship between the number of offensive rebounds in the season and the number of defensive
The dataset Hollywood- Movies2011 is introduced on page 93, and includes many variables for movies that were produced in Hollywood in 2011, including Budget and AudienceScore.(a) Use technology to create a scatterplot to show the relationship between the budget of a movie, in millions of dollars,
Hgt = height in inches, Age = age in years of a childdata point is a child 12 years old who is 60 inches tallTwo variables are defined, a regression equation is given, and one data point is given.(a) Find the predicted value for the data point and compute the residual.(b) Interpret the slope in
BAC = blood alcohol content (% of alcohol in the blood), Drinks = number of alcoholic drinks(Drinks); data point is an individual who consumed 3 drinks and had a BAC of 0.08Two variables are defined, a regression equation is given, and one data point is given.(a) Find the predicted value for the
Weight = maximum weight capable of bench pressing (pounds), Training = number of hours spent lifting weights a week(Training); data point is an individual who trains 5 hours a week and can bench 150 poundsTwo variables are defined, a regression equation is given, and one data point is given.(a)
Study = number of hours spent studying for an exam, Grade = grade on the exam(Study); data point is a student who studied 10 hours and received an 81 on the examTwo variables are defined, a regression equation is given, and one data point is given.(a) Find the predicted value for the data point and
Use technology to find the regression line to predict Y from X. 1.5 3 2.5
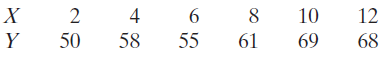
Use technology to find the regression line to predict Y from X. 4 6. 61 10 12 |Y 50 58 55 68 69
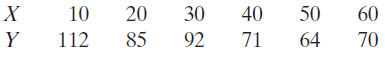
Use technology to find the regression line to predict Y from X. 40 30 |X 10 60 112 85 92 71 64 70
Use technology to find the regression line to predict Y from X. X 15 35 25 30 Y 532 466 478 320 303 349 275 221 40 45 50
Levels of carbon dioxide (CO2) in the atmosphere are rising rapidly, far above any levels ever before recorded. Levels were around 278 parts per million in 1800, before the Industrial Age, and had never, in the hundreds of thousands of years before that, gone above 300 ppm. Levels are now nearing
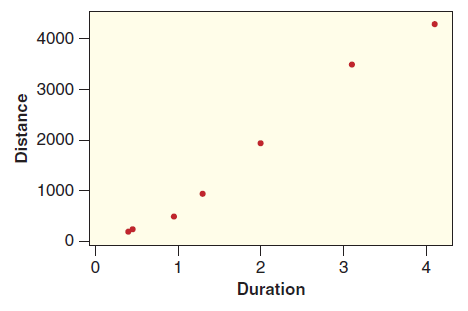
When honeybee scouts find a food source or a nice site for a new home, they communicate the location to the rest of the swarm by doing a €˜€˜waggle dance.€ They point in the direction of the site and dance longer for sites farther away. The rest of the bees use the
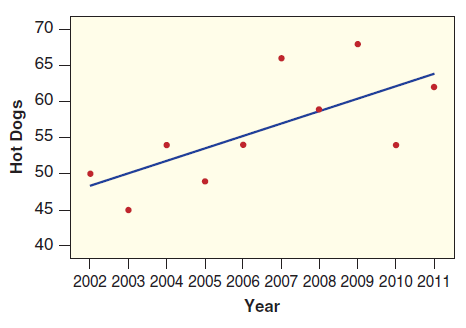
Every Fourth of July, Nathan€™s Famous in New York City holds a hot dog eating contest, which we discuss in Exercise 2.98. Table 2.21 on page 86 shows the winning number of hot dogs and buns eaten every year from 2002 to 2011, and the data are also available in HotDogs. Figure 2.70 shows
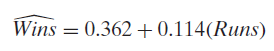
In Exercise 2.136 on page 100, we looked at the relationship between total hits by team in the 2010 season and division (NL or AL) in baseball. Two other variables in the BaseballHits dataset are the number of wins and the number of runs scored during the season. The dataset consists of values for
In Example 2.43 on page 123, we use the approval rating of a president running for re-election to predict the margin of victory or defeat in the election. We saw that the least squares line is(Approval). Interpret the slope and the intercept of the line in context. Margin = -36.5 +0.836
Using the data in the StudentSurvey dataset, we use technology to find that a regression line to predict weight (in pounds) from height (in inches) is(a) What weight does the line predict for a person who is 5 feet tall (60 inches)? What weight is predicted for someone 6 feet tall (72 inches)?(b)
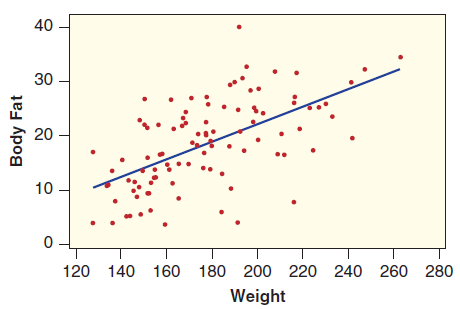
Figure 2.71 shows the data and regression line for using weight to predict body fat percentage. For the case with the largest positive residual, estimate the values of both variables. In addition, estimate the predicted body fat percent and the residual for that point.Figure 2.71Use the dataset
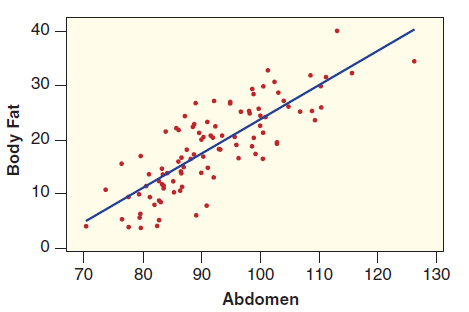
Figure 2.72 shows the data and regression line for using abdomen circumference to predict body fat percentage.Figure 2.72(a) Which scatterplot, the one using Weight in Figure 2.71 or the one using Abdomen in Figure 2.72, appears to contain data with a larger correlation?Figure 2.71(b) In Figure
The regression line for predicting body fat percent using neck circumference is(a) What body fat percent does the line predict for a person with a neck circumference of 35 cm? Of 40 cm?(b) Interpret the slope of the line in context.(c) One of the men in the study had a neck circumference of 38.7 cm
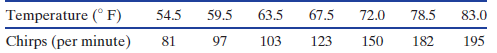
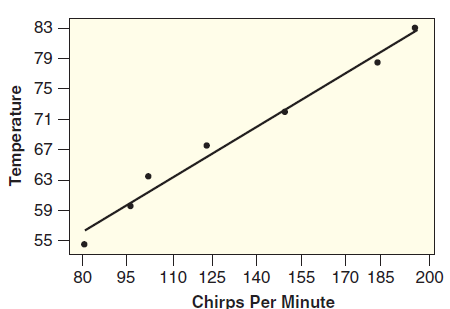
In the CricketChirpdataset given in Table 2.31 on page 108, welearn that the chirp rate of crickets is related to the temperature of the air.Table 2.31(a) Figure 2.73 shows the seven points together with the regression line. Does there appear to be a linear relationship between these two variables?
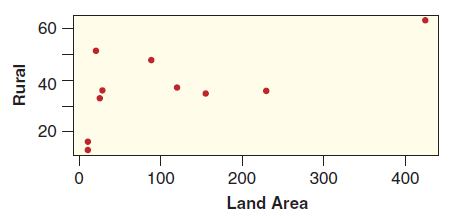
Two variables in the dataset AllCountries are the size of the country (in 1000 sq km) and the percent of the population living in rural areas. We are interested in using the size of the country (LandArea) to predict the percent rural (Rural). The values of these variables for a random sample of ten
In Exercise 2.205, we used a random sample of 10 countries to use the size of a country to predict the percent of the population living in rural areas. We now see how results change if we add the United States (Land Area: 9147.4, Rural: 18.3%) to the sample.(a) Use technology to find the new
Use the data in HollywoodMovies2011 to use revenue from a movie’s opening weekend (OpeningWeekend) to predict total world gross revenues by the end of the year (WorldGross). Both variables are in millions of dollars.(a) Use technology to create a scatterplot for this relationship. Describe the
In Exercise 2.172 on page 114, we introduce the dataset HappyPlanetIndex, which includes information for 143 countries to produce a €˜€˜happiness€ rating as a score of the health and well-being of the country€™s citizens, as well as information on the
In 2011, the Congressional Budget Office predicted that the US economy would grow by 2.8% per year on average over the decade from 2011 to 2021. At this rate, in 2021, the ratio of national debt to GDP (gross domestic product) is predicted to be 76% and the federal deficit is predicted to be $861
Correlation between height and weight for players on the 2010 Brazil World Cup team, using data from all 23 players on the roster.State whether the quantity described is a parameter or a statistic and give the correct notation.
Proportion of people who use an electric toothbrush, using data from a sample of 300 adults.State whether the quantity described is a parameter or a statistic and give the correct notation.
Proportion of registered voters in a county who voted in the last election, using data from the county voting records.State whether the quantity described is a parameter or a statistic and give the correct notation.
Average number of television sets per household in North Carolina, using data from a sample of 1000 households.State whether the quantity described is a parameter or a statistic and give the correct notation.
Average enrollment in charter schools in Illinois. In 2010, there were 95 charter schools in the state of Illinois and the total number of students attending the charter schools was 30,795.Give the correct notation for the quantity described and give its value.
Proportion of US adults who own a cell phone. In a survey of 2252 US adults, 82% said they had a cell phone.Give the correct notation for the quantity described and give its value.
Correlation between age and heart rate for patients admitted to an Intensive Care Unit. Data from the 200 patients included in the file ICU Admissions gives a correlation of 0.037.Give the correct notation for the quantity described and give its value.
Mean number of cell phone calls made or received per day by cell phone users. In a survey of 1917 cell phone users, the mean was 13.10 phone calls a day.Give the correct notation for the quantity described and give its value.
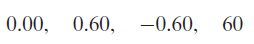
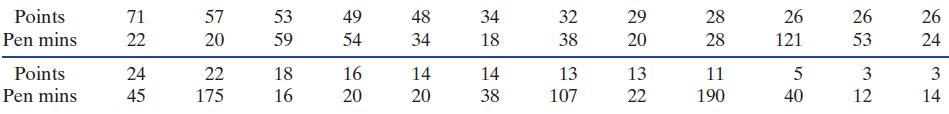
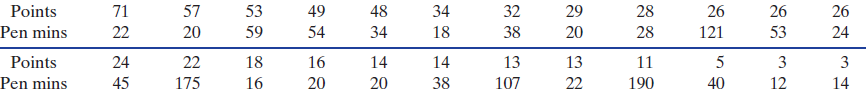
Correlation between points and penalty minutes for the 24 players with at least one point on the 2009€“2010 Ottawa Senators NHL hockey team. The data are given in Table 3.4 and the full data are available in the file Ottawa Senators.Table 3.4Give the correct notation for the quantity
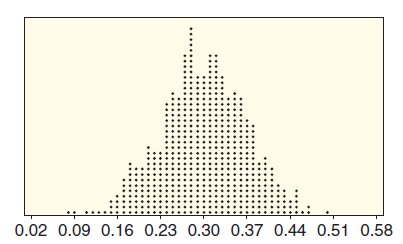
Figure 3.5(a) shows sample proportions from samples of size n = 40 from a population.Figure 3.5a.Refer to the sampling distributions given in Figure 3.5. In each case, estimate the value of the population parameter and estimate the standard error for the sample statistic. 0.02 0.09 0.16 0.23 0.30
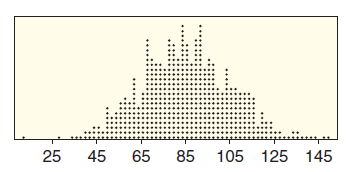
Figure 3.5(b) shows sample means from samples of size n = 30 from a population.Figure 3.5b.Refer to the sampling distributions given in Figure 3.5. In each case, estimate the value of the population parameter and estimate the standard error for the sample statistic. 25 45 65 85 105 125 145
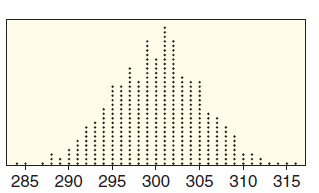
Figure 3.5(c) shows sample means from samples of size n = 100 from a population.Figure 3.5c.Refer to the sampling distributions given in Figure 3.5. In each case, estimate the value of the population parameter and estimate the standard error for the sample statistic. 285 290 295 300 305 310 315
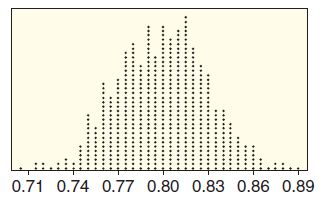
Figure 3.5(d) shows sample proportions from samples of size n = 180 from a population.Figure 3.5d.Refer to the sampling distributions given in Figure 3.5. In each case, estimate the value of the population parameter and estimate the standard error for the sample statistic. 0.71 0.74 0.77 0.80 0.83
Using the sampling distribution shown in Figure 3.5(a), how likely are these sample proportions:Figure 3.5a.(a) p̂ = 0.1(b) p̂ = 0.35(c) p̂ = 0.6Refer to the sampling distributions given in Figure 3.5. Several possible values are given for a sample statistic.
From its founding through 2012, the Rock and Roll Hall of Fame has inducted 273 groups or individuals. Forty-one of the inductees have been female or have included female members. The full dataset is available in Rock and Roll.(a) What proportion of inductees have been female or have included
In a random sample of 250 people, 180 agree.Give information about the proportion of a sample that agrees with a certain statement. Use StatKey or other technology to estimate the standard error from a bootstrap distribution generated from the sample. Then use the standard error to give a 95%
Table 3.4 on page 174 shows the number of points scored and penalty minutes for 24 ice hockey players on the Ottawa Senators NHL team for the 2009€“2010 season. The data are also stored in OttawaSenators. Assume that we consider these players to be a sample of all NHL players.Table 3.4(a)
Showing 1200 - 1300
of 2108
First
6
7
8
9
10
11
12
13
14
15
16
17
18
19
20
Last
Step by Step Answers