New Semester
Started
Get
50% OFF
Study Help!
--h --m --s
Claim Now
Question Answers
Textbooks
Find textbooks, questions and answers
Oops, something went wrong!
Change your search query and then try again
S
Books
FREE
Study Help
Expert Questions
Accounting
General Management
Mathematics
Finance
Organizational Behaviour
Law
Physics
Operating System
Management Leadership
Sociology
Programming
Marketing
Database
Computer Network
Economics
Textbooks Solutions
Accounting
Managerial Accounting
Management Leadership
Cost Accounting
Statistics
Business Law
Corporate Finance
Finance
Economics
Auditing
Tutors
Online Tutors
Find a Tutor
Hire a Tutor
Become a Tutor
AI Tutor
AI Study Planner
NEW
Sell Books
Search
Search
Sign In
Register
study help
mathematics
statistics the art and science
Statistics Unlocking The Power Of Data 1st Edition Robin H. Lock, Patti Frazer Lock, Kari Lock Morgan, Eric F. Lock, Dennis F. Lock - Solutions
Test H0: μ1 = μ2 vs Ha: μ1 ≠ μ2 using the sample results x̅1 = 15.3, s1 = 11.6 with n1 = 100 and x̅2 = 18.4, s2 = 14.3 with n2 = 80.Use the t-distribution and the given sample results to complete the test of the given hypotheses. Assume the results come from random samples, and if the
Exercise 6.116 introduced a study in which 2006 randomly selected US adults (age 18 or older) were asked to give the number of people in the last six months ‘‘with whom you discussed matters that are important to you.” The average number of close confidants for the full sample was 2.2. In
A recent study examines chocolate’s effects on blood vessel function in healthy people. In the randomized, double-blind, placebo-controlled study, 11 people received 46 grams (1.6 ounces) of dark chocolate (which is naturally flavonoid-rich) every day for two weeks, while a control group of 10
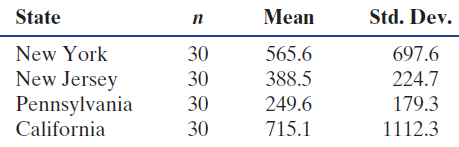
Find and interpret a 95% confidence interval for the difference in mean housing price between New York and New Jersey.Refer to the dataset Homes For Sale, which has data on houses available for sale in three Mid-Atlantic states (NY, NJ, and PA) as well as California (CA). Table 6.17 has summary
Find and interpret a 99% confidence interval for the difference in mean housing price between New Jersey and Pennsylvania.Refer to the dataset Homes For Sale, which has data on houses available for sale in three Mid-Atlantic states (NY, NJ, and PA) as well as California (CA). Table 6.17 has summary
Find and interpret a 90% confidence interval for the difference in mean housing price between California and New York.Refer to the dataset Homes For Sale, which has data on houses available for sale in three Mid-Atlantic states (NY, NJ, and PA) as well as California (CA). Table 6.17 has summary
Find and interpret a 95% confidence interval for the mean price of a home in California.Refer to the dataset Homes For Sale, which has data on houses available for sale in three Mid-Atlantic states (NY, NJ, and PA) as well as California (CA). Table 6.17 has summary statistics for each of the four
A 95% confidence interval for μ1 − μ2 using the sample results x̅1 = 5.2, s1 = 2.7, n1 = 10 and x̅2 = 4.9, s2 = 2.8, n2 = 8Use the t-distribution to find a confidence interval for a difference in means μ1 − μ2 given the relevant sample results. Give the best estimate for μ1 − μ2, the
A 99% confidence interval for μ1 − μ2 using the sample results x̅1 = 501, s1 = 115, n1 = 400 and x̅2 = 469, s2 = 96, n2 = 200Use the t-distribution to find a confidence interval for a difference in means μ1 − μ2 given the relevant sample results. Give the best estimate for μ1 − μ2,
A 90% confidence interval for μ1 − μ2 using the sample results x̅1 = 10.1, s1 = 2.3, n1 = 50 and x̅2 = 12.4, s2 = 5.7, n2 = 50Use the t-distribution to find a confidence interval for a difference in means μ1 − μ2 given the relevant sample results. Give the best estimate for μ1 − μ2,
A 95% confidence interval for μ1 − μ2 using the sample results x̅1 = 75.2, s1 = 10.7, n1 = 30 and x̅2 = 69.0, s2 = 8.3, n2 = 20Use the t-distribution to find a confidence interval for a difference in means μ1 − μ2 given the relevant sample results. Give the best estimate for μ1 − μ2,
Refer to the situation described in Exercise 6.226 where two statistics instructors are comparing class means on common exams. Suppose that the class sizes are both 100, rather than 25. If all else remains the same, are we more, less, or equally likely to see a difference in means as large as 3 or
Professor A and Professor B are teaching sections of the same introductory statistics course and decide to give common exams. They both have 25 students and design the exams to produce a grade distribution that follows a bell curve with mean μ = 75 and standard deviation σ = 10.(a) Suppose
The distribution of sample means x̅m − x̅f, where x̅m represents the mean Critical Reading score for a sample of 50 males and x̅f represents the mean Critical Reading score for a sample of 50 females, is centered at 5 with a standard deviation of 22.5. Give notation and define the quantity we
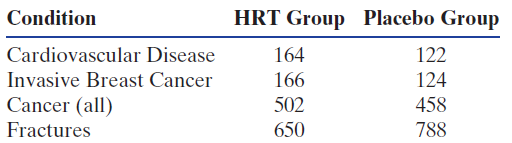
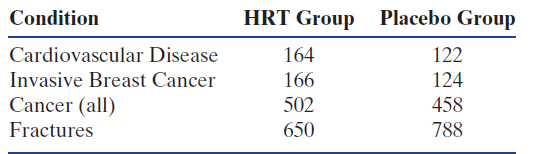
Does HRT influence the chance of a woman having a fracture?Refer to a study on hormone replacement therapy. Until 2002, hormone replacement therapy (HRT), taking hormones to replace those the body no longer makes after menopause, was commonly prescribed to post-menopausal women. However, in 2002
In the dataset ICU-Admissions, the variable Infection indicates whether the ICU (Intensive Care Unit) patient had an infection (1) or not (0) and the variable Sex gives the gender of the patient (0 for males and 1 for females.) Use technology to test at a 5% level whether there is a difference
In the dataset ICU-Admissions, the variable Service indicates whether the ICU (Intensive Care Unit) patient had surgery (1) or other medical treatment (0) and the variable Sex gives the gender of the patient (0 for males and 1 for females.) Use technology to test at a 5% level whether there is a
Samples of size 100 from Population 1 with mean 87 and standard deviation 12 and samples of size 80 from Population 2 with mean 81 and standard deviation 15Random samples of the given sizes are drawn from populations with the given means and standard deviations. For each scenario:(a) Find the mean
Samples of size 25 from Population 1 with mean 6.2 and standard deviation 3.7 and samples of size 40 from Population 2 with mean 8.1 and standard deviation 7.6Random samples of the given sizes are drawn from populations with the given means and standard deviations. For each scenario:(a) Find the
Samples of size 50 from Population 1 with mean 3.2 and standard deviation 1.7 and samples of size 50 from Population 2 with mean 2.8 and standard deviation 1.3Random samples of the given sizes are drawn from populations with the given means and standard deviations. For each scenario:(a) Find the
Samples of size 300 from Population 1 with mean 75 and standard deviation 18 and samples of size 500 from Population 2 with mean 83 and standard deviation 22Random samples of the given sizes are drawn from populations with the given means and standard deviations. For each scenario:(a) Find the mean
Find the endpoints of the t-distribution with 2.5% beyond them in each tail if the samples have sizes n1 = 15 and n2 = 25.Assume the samples are random samples from distributions that are reasonably normally distributed, and that a t-statistic will be used for inference about the difference in
Find the endpoints of the t-distribution with 5% beyond them in each tail if the samples have sizes n1 = 8 and n2 = 10.Assume the samples are random samples from distributions that are reasonably normally distributed, and that a t-statistic will be used for inference about the difference in sample
Find the area in a t-distribution less than−1.4 if the samples have sizes n1 = 30 and n2 = 40.Assume the samples are random samples from distributions that are reasonably normally distributed, and that a t-statistic will be used for inference about the difference in sample means. State the
Find the area in a t-distribution above 2.1 if the samples have sizes n1 = 12 and n2 = 12.Assume the samples are random samples from distributions that are reasonably normally distributed, and that a t-statistic will be used for inference about the difference in sample means. State the degrees of
The average score on the Mathematics part of the SAT exam for males is 534 with a standard deviation of 118, while the average score for females is 500 with a standard deviation of 112.(a) If random samples are taken with 40 males and 60 females, find the mean and standard deviation of the
The average score on the Writing part of the SAT exam for males is 486 with a standard deviation of 112, while the average score for females is 498 with a standard deviation of 111.(a) If random samples are taken with 100 males and 100 females, find the mean and standard deviation of the
The distribution of sample means x̅N − x̅E, where x̅N represents the mean Critical Reading score for a sample of 100 people for whom the native language is not English and x̅E represents the mean Critical Reading score for a sample of 100 people whose native language is English, is centered
Difference in mean commuting distance (in miles) between commuters in Atlanta and commuters in St. Louis, using n1 = 500, x̅1 = 18.16, and s1 = 13.80 for Atlanta and n2 = 500, x̅2 = 14.16, and s2 = 10.75 for St. Louis.Use StatKey or other technology to generate a bootstrap distribution of sample
The distribution of sample means x̅N − x̅E, where x̅N represents the mean Mathematics score for a sample of 100 people for whom the native language is not English and x̅E represents the mean Mathematics score for a sample of 100 people whose native language is English, is centered at 10 with
Difference in mean commuting time (in minutes) between commuters in Atlanta and commuters in St. Louis, using n1 = 500, x̅1 = 29.11, and s1 = 20.72 for Atlanta and n2 = 500, x̅2 = 21.97, and s2 = 14.23 for St. Louis.Use StatKey or other technology to generate a bootstrap distribution of sample
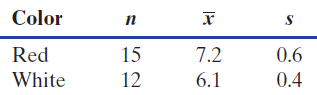
Exercise 1.89 on page 42 described a recent study which examines the impact of the color red on how attractive men perceive women to be. In the study, men were randomly divided into two groups and were asked to rate the attractiveness of women on a scale of 1 (not at all attractive) to 9 (extremely
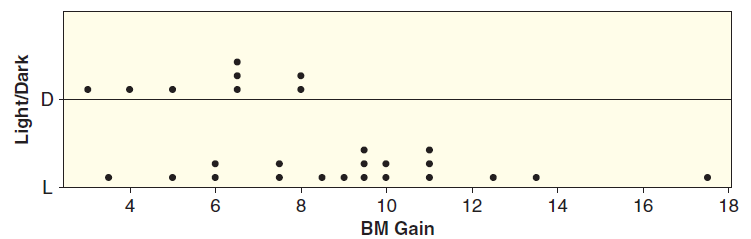
A study described in Data A.1 on page 136 found that mice exposed to light at night gained substantially more weight than mice who had complete darkness at night, despite the fact that calorie intake and activity levels were the same for the two groups. How large is the effect of light on weight
How big is the home field advantage in the National Football League (NFL)? To investigate this question, we select a sample of 80 games from the 2011 regular season and find the home team scored an average of 25.16 points with standard deviation 10.14 points. In a separate sample of 80 different
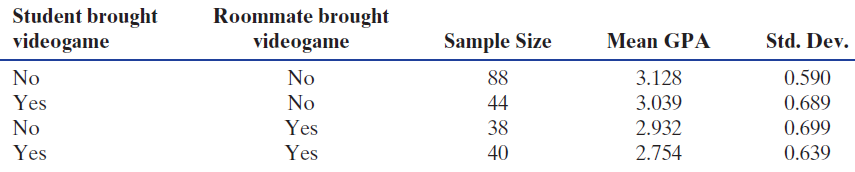
Considering only students who do not bring a videogame to campus, find and interpret a 95% confidence interval for the difference in mean GPA between students whose roommate does not bring a videogame and those whose roommate does bring a videogame. Comment on the effect on these students of having
Considering only students who do bring a videogame to campus, find and interpret a 95% confidence interval for the difference in mean GPA between students whose roommate does not bring a videogame and those whose roommate does bring a videogame. Comment on the effect on these students of having a
Considering only students whose roommate does not bring a videogame to campus, find and interpret a 95% confidence interval for the difference in mean GPA between students who bring a videogame and those who do not bring a videogame. Comment on the effect on these students of bringing a
Considering only students whose roommate does bring a videogame to campus, find and interpret a 95% confidence interval for the difference in mean GPA between students who bring a videogame and those who do not bring a videogame. Comment on the effect on these students of bringing a videogame.We
We consider the effect of neither student bringing videogames compared to both students bringing them, still using the data in Table 6.19.(a) Find and interpret a 95% confidence interval for the difference in means between students in rooms in which neither the student nor the roommate brings a
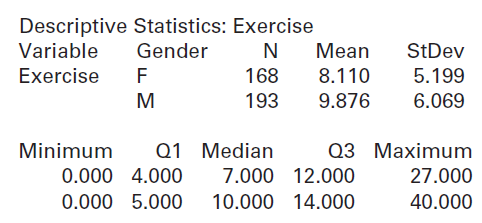
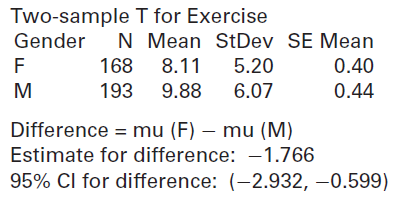
The dataset StudentSurvey has information from males and females on the number of hours spent exercising in a typical week. Computer output of descriptive statistics for the number of hours spent exercising, broken down by gender, is given:(a) How many females are in the dataset? How many males?(b)
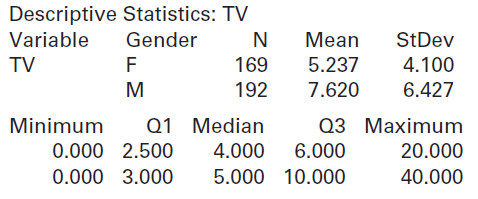
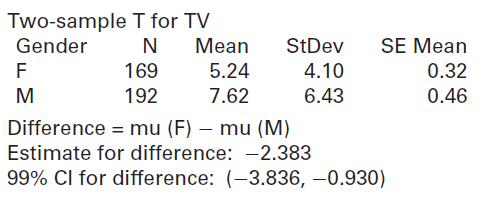
The dataset StudentSurvey has information from males and females on the number of hours spent watching television in a typical week. Computer output of descriptive statistics for the number of hours spent watching TV, broken down by gender, is given:(a) In the sample, which group watches more TV,
Use technology and the NutritionStudy dataset to find a 95% confidence interval for the difference in number of grams of fiber (Fiber) eaten in a day between males and females. Interpret the answer in context. Is ‘‘No difference” between males and females a plausible option for the population
Use technology and the ICU-Admissions dataset to find a 95% confidence interval for the difference in systolic blood pressure (Systolic) upon admission to the Intensive Care Unit at the hospital based on survival of the patient (Status with 0 indicating the patient lived and 1 indicating the
Test H0: μ1 = μ2 vs Ha: μ1 > μ2 using the sample results x̅1 = 56, s1 = 8.2 with n1 = 30 and x̅2 = 51, s2 = 6.9 with n2 = 40.Use the t-distribution and the given sample results to complete the test of the given hypotheses. Assume the results come from random samples, and if the sample
Does HRT influence the chance of a woman getting cancer of any kind?Refer to a study on hormone replacement therapy. Until 2002, hormone replacement therapy (HRT), taking hormones to replace those the body no longer makes after menopause, was commonly prescribed to post-menopausal women. However,
Does HRT influence the chance of a woman getting invasive breast cancer?Refer to a study on hormone replacement therapy. Until 2002, hormone replacement therapy (HRT), taking hormones to replace those the body no longer makes after menopause, was commonly prescribed to post-menopausal women.
Does HRT influence the chance of a woman getting cardiovascular disease?Refer to a study on hormone replacement therapy. Until 2002, hormone replacement therapy (HRT), taking hormones to replace those the body no longer makes after menopause, was commonly prescribed to post-menopausal women.
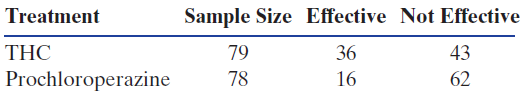
An article in the New York Times on January 17, 1980 reported on the results of an experiment that compared an existing treatment drug (prochloroperazine) with using THC (the active ingredient in marijuana) for combating nausea in patients undergoing chemotherapy for cancer. Patients being treated
The dataset HomesForSale has data on houses available for sale in three Mid-Atlantic states (NY, NJ, and PA). For this exercise we are specifically interested in homes for sale in New York and New Jersey. We have information on 30 homes from each state and observe the proportion of homes with more
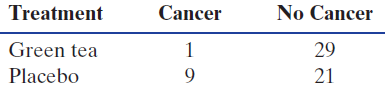
A preliminary study suggests a benefit from green tea for those at risk of prostate cancer. The study involved 60 men with PIN lesions, some of which turn into prostate cancer. Half the men, randomly determined, were given 600 mg a day of a green tea extract while the other half were given a
In a randomly selected sample of 2237 US adults, 1754 identified themselves as people who use the Internet regularly while the other 483 indicated that they do not. In addition to Internet use, participants were asked if they agree with the statement ‘‘most people can be trusted.” The results
A recent study compared 298 children with Autism Spectrum Disorder to 1507 randomly selected control children without the disorder. Of the children with autism, 20 of the mothers had used antidepressant drugs during the year before pregnancy or the first trimester of pregnancy. Of the control
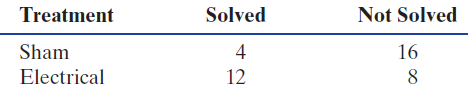
In Exercise 4.134 on page 279, we used the data in Table 6.13 to conduct a randomization test to see if there was evidence that electrical stimulation of the brain helped people solve a problem that requires fresh insight. Explain why it would not be appropriate to conduct this test using the
In the Physician’s Health Study, introduced in Data 1.6 on page 37, 22,071 male physicians participated in a study to determine whether taking a daily low-dose aspirin reduced the risk of heart attacks. The men were randomly assigned to two groups and the study was double-blind. After five years,
Secession In Example 6.4 on page 360 we analyzed a poll of 800 Quebecers, in which 28% thought that the province of Quebec should separate from Canada. Another poll of 500 Texans found that 18% thought that the state of Texas should separate from the United States.(a) In the sample of 800 people,
Studies suggest that when young men interact with a woman who is in the fertile period of her menstrual cycle, they pick up subconsciously on subtle changes in her skin tone, voice, and scent. A study introduced in Exercise B.18 suggests that men may even change their speech patterns around
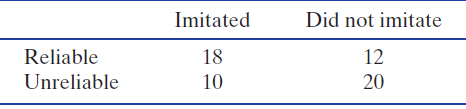
A new study indicates that babies may choose not to learn from someone they don€™t trust. A group of 60 babies, aged 13 to 16 months, were randomly divided into two groups. Each baby watched an adult express great excitement while looking into a box. The babies were then shown the box and
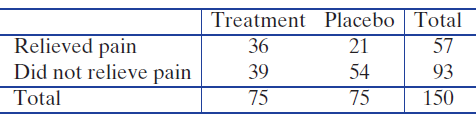
Table 6.11 shows data on whether or not a treatment relieved pain for patients. Test whether the treatment is significantly better than a placebo at relieving pain. The patients were randomly allocated to the two groups and the experiment was double-blind.Table 6.11(a) Find the relevant sample
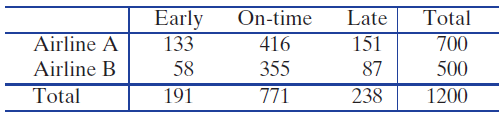
Table 6.10 gives flight arrival numbers from a random sample of flights for two airlines. Test whether there is a difference between the two airlines in the percent of flights that arrive late.Table 6.10(a) Find the relevant sample proportions in each group and the pooled proportion.(b) Complete
Test whether males are less likely than females to support a ballot initiative, if 24% of a random sample of 50 males plan to vote yes on the initiative and 32% of a random sample of 50 females plan to vote yes.(a) Find the relevant sample proportions in each group and the pooled proportion.(b)
Test whether people with a specific genetic marker are more likely to have suffered from clinical depression than people without the genetic marker, using the information that 38% of the 42 people in a sample with the genetic marker have had clinical depression while 12% of the 758 people in the
Test whether patients getting Treatment A are more likely to survive, if 63 out of 82 getting Treatment A survive and 31 out of 67 getting Treatment B survive.(a) Find the relevant sample proportions in each group and the pooled proportion.(b) Complete the hypothesis test using the normal
Test whether there is a difference between two groups in the proportion who voted, if 45 out of a random sample of 70 in Group 1 voted and 56 out of a random sample of 100 in Group 2 voted.(a) Find the relevant sample proportions in each group and the pooled proportion.(b) Complete the hypothesis
The dataset ICUAdmissions contains information on patients admitted to an Intensive Care Unit. The variable Status indicates whether the patient lived (0) or died (1), while the variable Sex indicates whether the patient is male (0) or female (1). Use technology to find a 95% confidence interval
In the dataset ICU-Admissions, the variable Status indicates whether the ICU (Intensive Care Unit) patient lived (0) or died (1), while the variable Infection indicates whether the patient had an infection (1 for yes, 0 for no) at the time of admission to the ICU. Use technology to find a 95%
Difference in proportion who favor a gun control proposal, using p̂f = 0.82 for 379 out of 460 females and p̂m = 0.61 for 318 out of 520 for males. (We found a 90% confidence interval for this difference in Exercise 6.175.)Find a 95% confidence interval for the difference in proportions two ways,
Difference in proportion who use text messaging, using p̂t = 0.87 with n = 800 for teens and p̂a = 0.72 with n = 2252 for adults.Find a 95% confidence interval for the difference in proportions two ways, using StatKey or other technology and percentiles from a bootstrap distribution and using the
Find a 95% confidence interval for the difference in proportions of women who fracture a bone taking HRT vs taking a placebo.Refer to a study on hormone replacement therapy. Until 2002, hormone replacement therapy (HRT), taking hormones to replace those the body no longer makes after menopause, was
Find a 95% confidence interval for the difference in proportions of women who get any type of cancer taking HRT vs taking a placebo.Refer to a study on hormone replacement therapy. Until 2002, hormone replacement therapy (HRT), taking hormones to replace those the body no longer makes after
Find a 95% confidence interval for the difference in proportions of women who get invasive breast cancer taking HRT vs taking a placebo.Refer to a study on hormone replacement therapy. Until 2002, hormone replacement therapy (HRT), taking hormones to replace those the body no longer makes after
Find a 95% confidence interval for the difference in proportions of women who get cardiovascular disease taking HRT vs taking a placebo.Refer to a study on hormone replacement therapy. Until 2002, hormone replacement therapy (HRT), taking hormones to replace those the body no longer makes after
In Example 2.6 on page 51 we consider data from a sample of statistics students that is stored in StudentSurvey. One of the survey questions asked which award students would most like to win from among an Academy Award, Nobel Prize, and Olympic gold medal. Among the 193 male students who responded,
Data 1.3 on page 10 discusses a study designed to test whether applying metal tags is detrimental to penguins. Exercise 6.178 investigates the survival rate of the penguins. The scientists also studied the breeding success of the metal- and electronic-tagged penguins. Metal-tagged penguins
Data 1.3 on page 10 discusses a study designed to test whether applying metal tags is detrimental to penguins. One variable examined is the survival rate 10 years after tagging. The scientists observed that 10 of the 50 metal tagged penguins survived, compared to 18 of the 50 electronic tagged
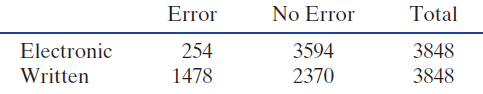
Errors in medical prescriptions occur and a study examined whether electronic prescribing may help reduce errors. Two groups of doctors used written prescriptions and had similar error rates before the study. One group switched to e-prescriptions while the other continued to use written
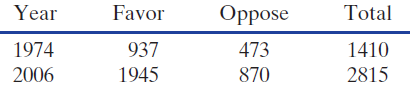
The General Social Survey (GSS) has been collecting demographic, behavioral, and attitudinal information since 1972 to monitor changes within the US and to compare the US to other nations. Support for capital punishment (the death penalty) in the US is shown in 1974 and in 2006 in the two-way table
A survey reported in Time magazine included the question ‘‘Do you favor a federal law requiring a 15 day waiting period to purchase a gun?” Results from a random sample of US citizens showed that 318 of the 520 men who were surveyed supported this proposed law while 379 of the 460 women
In a randomly selected sample of 2237 US adults, 1754 identified themselves as people who use the Internet regularly while the other 483 indicated that they do not use the Internet regularly. In addition to Internet use, participants were asked if they agree with the statement ‘‘most people can
A 95% confidence interval for p1 − p2 given counts of 240 yes out of 500 sampled for Group 1 and 450 yes out of 1000 sampled for Group 2.Use the normal distribution to find a confidence interval for a difference in proportions p1 − p2 given the relevant sample results. Give the best estimate
A 99% confidence interval for p1 − p2 given counts of 114 yes out of 150 sampled for Group 1 and 135 yes out of 150 sampled for Group 2Use the normal distribution to find a confidence interval for a difference in proportions p1 − p2 given the relevant sample results. Give the best estimate for
A 90% confidence interval for p1 − p2 given that p̂1 = 0.20 with n1 = 50 and p̂2 = 0.32 with n2 = 100Use the normal distribution to find a confidence interval for a difference in proportions p1 − p2 given the relevant sample results. Give the best estimate for p1 − p2, themargin of error,
A 95% confidence interval for p1 − p2 given that p̂1 = 0.72 with n1 = 500 and p̂2 = 0.68 with n2 = 300Use the normal distribution to find a confidence interval for a difference in proportions p1 − p2 given the relevant sample results. Give the best estimate for p1 − p2, themargin of error,
According to the 2006 Australia Census,43 25.5% of Australian women over the age of 25 had a college degree, while the percentage for Australian men was 21.4%. Suppose we select random samples of 200 women and 200 men from this population and look at the differences in proportions with college
Ron flips a coin n1 times and Freda flips a coin n2 times. We can assume all coin flips are fair: The coin has an equal chance of landing heads or tails. In each of the following cases, state whether inference for a difference in proportions is appropriate using the methods of this section. If so,
Sample A has a count of 90 successes with n = 120 and Sample B has a count of 180 successes with n = 300.Use StatKey or other technology to generate a bootstrap distribution of sample differences in proportions and find the standard error for that distribution. Compare the result to the value
Sample A has a count of 30 successes with n = 100 and Sample B has a count of 50 successes with n = 250.Use StatKey or other technology to generate a bootstrap distribution of sample differences in proportions and find the standard error for that distribution. Compare the result to the value
The All-Countries dataset shows that the percent of the population living in rural areas is 57.3% in Egypt and 21.6% in Jordan. Suppose we take random samples of size 400 people from each country, and compute the difference in sample proportions p̂E − p̂J, where p̂E represents the sample
We see in the All-Countries dataset that the percent of the population living in rural areas is 8.0 in Argentina and 34.4 in Bolivia. Suppose we take random samples of size 200 from each country, and compute the difference in sample proportions p̂A − p̂B, where p̂A represents the sample
Of the 50 states in the Unites States, Alaska has the largest percentage of males and Rhode Island has the largest percentage of females. (Interestingly, Alaska is the largest state and Rhode Island is the smallest). According to the 2010 US Census, the population of Alaska is 52.0% male and the
We see in the All-Countries dataset that the percent of the population that is over 65 is 13.4 in Australia and 12.5 in New Zealand. Suppose we take random samples of size 500 from Australia and size 300 from New Zealand, and compute the difference in sample proportions p̂A − p̂NZ, where p̂A
We see in the All-Countries dataset that the percent of the population that is elderly (over 65 years old) is 17.0 in Austria and 15.9 in Denmark. Suppose we take random samples of size 200 from each of these countries and compute the difference in sample proportions p̂A − p̂D, where p̂A
(a) In a taste test, compare the proportion of tasters who prefer one brand of cola to the proportion who prefer the other brand.(b) Compare the proportion of males who voted in the last election to the proportion of females who voted in the last election.(c) Compare the graduation rate (proportion
(a) Compare the proportion of students who use a Windows-based PC to the proportion who use a Mac.(b) Compare the proportion of students who study abroad between those attending public universities and those at private universities.(c) Compare the proportion of in-state students at a university to
Samples of size 500 from population A with proportion 0.58 and samples of size 200 from population B with proportion 0.49If random samples of the given sizes are drawn from populations with the given proportions:(a) Find the mean and standard error of the distribution of differences in sample
Samples of size 40 from population A with proportion 0.30 and samples of size 30 from population B with proportion 0.24If random samples of the given sizes are drawn from populations with the given proportions:(a) Find the mean and standard error of the distribution of differences in sample
Samples of size 100 from population A with proportion 0.20 and samples of size 50 from population B with proportion 0.30If random samples of the given sizes are drawn from populations with the given proportions:(a) Find the mean and standard error of the distribution of differences in sample
Samples of size 80 from population A with proportion 0.40 and samples of size 60 from population B with proportion 0.10If random samples of the given sizes are drawn from populations with the given proportions:(a) Find the mean and standard error of the distribution of differences in sample
Samples of size 300 from population A with proportion 0.15 and samples of size 300 from population B with proportion 0.20If random samples of the given sizes are drawn from populations with the given proportions:(a) Find the mean and standard error of the distribution of differences in sample
Samples of size 50 from population A with proportion 0.70 and samples of size 75 from population B with proportion 0.60If random samples of the given sizes are drawn from populations with the given proportions:(a) Find the mean and standard error of the distributionof differences in sample
The variable Fouls in the dataset NBAPlayers2011 shows the total number of fouls during the 2010-11 season for all players in the NBA (National Basketball Association) who played at least 24 minutes per game that season. We use this group as a sample of all NBA players in all seasons who play
Showing 700 - 800
of 2108
1
2
3
4
5
6
7
8
9
10
11
12
13
14
15
Last
Step by Step Answers