New Semester
Started
Get
50% OFF
Study Help!
--h --m --s
Claim Now
Question Answers
Textbooks
Find textbooks, questions and answers
Oops, something went wrong!
Change your search query and then try again
S
Books
FREE
Study Help
Expert Questions
Accounting
General Management
Mathematics
Finance
Organizational Behaviour
Law
Physics
Operating System
Management Leadership
Sociology
Programming
Marketing
Database
Computer Network
Economics
Textbooks Solutions
Accounting
Managerial Accounting
Management Leadership
Cost Accounting
Statistics
Business Law
Corporate Finance
Finance
Economics
Auditing
Tutors
Online Tutors
Find a Tutor
Hire a Tutor
Become a Tutor
AI Tutor
AI Study Planner
NEW
Sell Books
Search
Search
Sign In
Register
study help
mathematics
statistics the art and science
Statistics Unlocking The Power Of Data 1st Edition Robin H. Lock, Patti Frazer Lock, Kari Lock Morgan, Eric F. Lock, Dennis F. Lock - Solutions
The US Food and Drug Administration has a limit for mercury content in fish of 1.0 ppm (parts per million), while in Canada the limit is 0.5 ppm. Use the variable Avg- Mercury in the FloridaLakes dataset to test whether there is evidence that average mercury level of fish (large-mouth bass) in
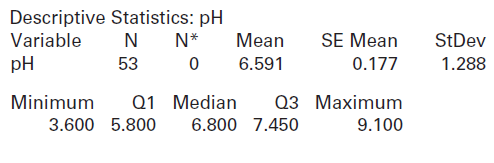
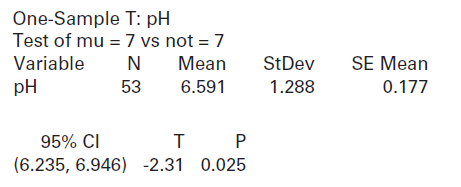
The pH of a liquid is a measure of its acidity or alkalinity. Pure water has a pH of 7, which is neutral. Solutions with a pH less than 7 are acidic while solutions with a pH greater than 7 are basic or alkaline. The dataset FloridaLakes gives information, including pH values, for a sample of lakes
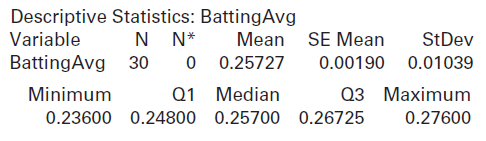
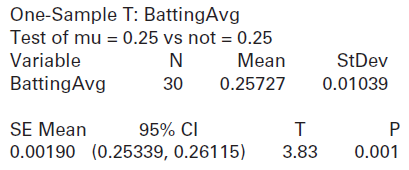
The dataset BaseballHits gives 2010 season statistics for all Major League Baseball teams. We treat this as a sample of all MLB teams in all years. Computer output of descriptive statistics for the variable giving the batting average is shown:(a) How many teams are included in the dataset? What is
We are interested in whether or not the average cost of a house in Canton, NY (the hometown of the Lock family) is significantly different from the national average of $265,000. Table 6.5 and the histogram in Figure 6.19 show the cost (in thousands of dollars) of a sample of 10 houses for sale in
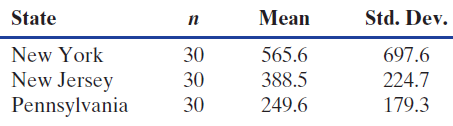
The dataset HomesFor- Sale has data on houses available for sale in three Mid-Atlantic states (NY, NJ, and PA). Table 6.4 (also used in Exercise 6.100) shows the mean and standard deviation from the three Mid- Atlantic states, in thousands of dollars. Use this table, the knowledge that within the
Susan is in charge of quality control at a small fruit juice bottling plant. Each bottle produced is supposed to contain exactly 12 fluid ounces (fl oz) of juice. Susan decides to test this by randomly sampling 30 filled bottles and carefully measuring the amount of juice inside each. She will
In the mid-1990s a Nabisco marketing campaign claimed that there were at least 1000 chips in every bag of Chips Ahoy! cookies. A group of Air Force cadets collected a sample of 42 bags of Chips Ahoy! cookies, bought from locations all across the country, to verify this claim. The cookies were
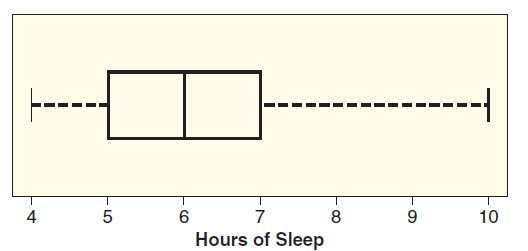
It is generally recommended that adults sleep at least 8 hours each night. One of the authors recently asked some of her students (undergraduate and graduate students at Harvard) how many hours each had slept the previous night, curious as to whether her students are getting enough sleep. The data
In a study conducted in Paris, France, equal amounts of pigeon feed were spread on the ground in two adjacent locations. A human feeder was present in both sites, with one acting as a hostile feeder running at the birds to scare them away and the other acting as a neutral feeder and just observing.
Autistic children often have a small head circumference at birth, followed by a sudden and excessive increase in head circumference during the first year of life. A recent study examined the brain tissue in autopsies of seven autistic male children between the ages of 2 and 16. The mean number of
Most US adults have social ties with a large number of people, including friends, family, co-workers, and other acquaintances. It is nearly impossible for most people to reliably list all the people they know, but using a mathematical model, social analysts estimate that, on average, a US adult has
Test H0: μ = 500 vs Ha: μ ≠ 500 using the sample results x̅ = 432, s = 118, with n = 75.Use the t-distribution and the sample results to complete the test of the hypotheses. Use a5%significance level. Assume the results come from a random sample, and if the sample size is small, assume the
Test H0: μ = 4 vs Ha: μ ≠ 4 using the sample results x̅ = 4.8, s = 2.3, with n = 15.Use the t-distribution and the sample results to complete the test of the hypotheses. Use a5%significance level. Assume the results come from a random sample, and if the sample size is small, assume the
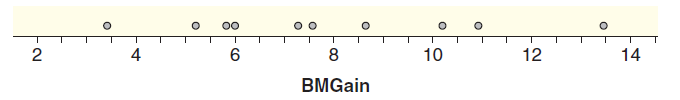
Test H0: μ = 10 vs Ha: μ > 10 using the sample results x̅ = 13.2, s = 8.7, with n = 12.Use the t-distribution and the sample results to complete the test of the hypotheses. Use a 5% significance level. Assume the results come from a random sample, and if the sample size is small, assume the
Test H0: μ = 120 vs Ha: μ < 120 using the sample results x̅ = 112.3, s = 18.4, with n = 100.Use the t-distribution and the sample results to complete the test of the hypotheses. Use a 5% significance level. Assume the results come from a random sample, and if the sample size is small, assume
Test H0: μ = 100 vs Ha : μ < 100 using the sample results x̅ = 91.7, s = 12.5, with n = 30.Use the t-distribution and the sample results to complete the test of the hypotheses. Use a 5% significance level. Assume the results come from a random sample, and if the sample size is small, assume
Test H0: μ = 15 vs Ha : μ > 15 using the sample results x̅ = 17.2, s = 6.4, with n = 40.Use the t-distribution and the sample results to complete the test of the hypotheses. Use a 5% significance level. Assume the results come from a random sample, and if the sample size is small, assume the
Use technology and the NutritionStudy dataset to find a 95% confidence interval for the mean number of grams of fiber (Fiber) people eat in a day. Interpret the answer in context.
Use technology and the RestaurantTips dataset to find a 95% confidence interval for the mean tip percentage (PctTip) at the restaurant. Interpret the answer in context.
Find the sample size needed to give, with 95% confidence, a margin of error within ±3, if the estimated standard deviation is σ̃ = 100. If the estimated standard deviation is σ̃ = 50. If the estimated standard deviation is σ̃ = 10. Comment on how the variability in the population influences
Find the sample size needed to give a margin of error within ±3 with 99% confidence. With 95% confidence. With 90% confidence. Assume that we use σ̃ = 30 as our estimate of the standard deviation in each case. Comment on the relationship between the sample size and the confidence level
Find the sample size needed to give, with 95% confidence, a margin of error within ±10. Within ±5. Within ±1. Assume that we use σ̃ = 30 as our estimate of the standard deviation in each case. Comment on the relationship between the sample size and the margin of error.We examine the effect of
In Exercise 6.128, we see that plastic microparticles are contaminating the world’s shorelines and that much of the pollution appears to come from fibers from washing polyester clothes. The same study referenced in Exercise 6.128 also took samples from ocean beaches. Five samples were taken from
Plastic microparticles are contaminating the world’s shorelines (see Exercise 6.129), and much of this pollution appears to come from fibers from washing polyester clothes. The worst offender appears to be fleece, and a recent study found that the mean number of polyester fibers discharged into
In Exercise 6.116 on page 386, we see that the average number of close confidants in a random sample of 2006 US adults is 2.2 with a standard deviation of 1.4. If we want to estimate the number of close confidants with a margin of error within ±0.05 and with 99% confidence, how large a sample is
Using the dataset NutritionStudy, we calculate that the average number of grams of fat consumed in a day for the sample of n = 315 US adults in the study is x̅ = 77.03 grams with s = 33.83 grams.(a) Find and interpret a 95% confidence interval for the average number of fat grams consumed per day
In the 2010-11 National Hockey League (NHL) regular season, the number of penalty minutes per game for each of the 30 teams ranged from a low of 8.8 for the Florida Panthers to a high of 18.0 for the most penalized New York Islanders. All 30 data values are given in Table 6.3 and are also available
Mean price of a used Mustang car online, in $1000s, using data in MustangPrice with x̅ = 15.98, s = 11.11, and n = 25Find a 95% confidence interval for the mean two ways: using StatKey or other technology and percentiles from a bootstrap distribution and using the t-distribution and the formula
Mean distance of a commute for a worker in Atlanta, using data in CommuteAtlanta with x̅ = 18.156 miles, s = 13.798, and n = 500Find a 95% confidence interval for the mean two ways: using StatKey or other technology and percentiles from a bootstrap distribution and using the t-distribution and the
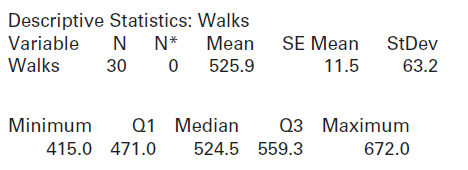
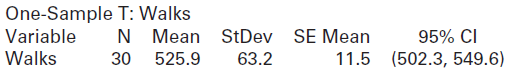
The dataset BaseballHits gives 2010 season statistics for all Major League Baseball (MLB) teams. We treat this as a sample of all MLB teams in all years. Computer output of descriptive statistics for the variable giving the number of Walks is shown:(a) How many teams are included in the dataset?
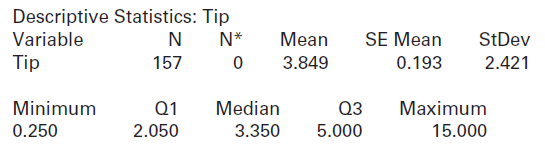
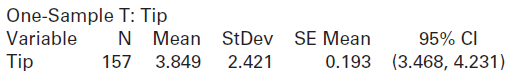
The dataset RestaurantTips has information from First Crush bistro in northern New York state. Computer output of descriptive statistics for the variable giving the size of the tip is shown:(a) How many tips are included in the dataset? What is the mean? What is the standard deviation?(b) Compute
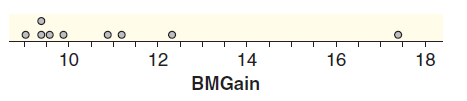
Data A.1 on page 136 introduces a study in which mice that had a light on at night (rather than complete darkness) ate most of their calories when they should have been resting. These mice gained a significant amount of weight, despite eating the same number of calories as mice kept in total
Data A.1 on page 136 introduces a study in which mice that had a dim light on at night (rather than complete darkness) ate most of their calories when they should have been resting. These mice gained a significant amount of weight, despite eating the same number of calories as mice kept in total
Scientists estimate that there are 10 times more bacterial cells in your body than your own body’s cells, and new studies on bacteria in the gut indicate that your gut microbes might be influencing you more than you realize, having positive or negative effects on health, development, and possibly
Gribbles are small, pale white, marine worms that bore through wood. While sometimes considered a pest since they can wreck wooden docks and piers, they are now being studied to determine whether the enzyme they secrete will allow us to turn inedible wood and plant waste into biofuel. A sample of
In a recent study, 2006 randomly selected US adults (age 18 or older) were asked to give the number of people in the last six months ‘‘with whom you discussed matters that are important to you.” The average number of close confidants was 2.2, with a standard deviation of 1.4.(a) Find the
In the dataset StudentSurvey, 361 students recorded the number of hours of television they watched per week. The average is x̅ = 6.504 hours with a standard deviation of 5.584. Find a 99% confidence interval for μ and interpret the interval in context. In particular, be sure to indicate the
A margin of error within ±12 with 95% confidence, assuming we estimate that σ ≈ 125What sample size is needed to give the desired margin of error in estimating a population mean with the indicated level of confidence?
A margin of error within ±0.5 with 90% confidence, if we make a reasonable estimate that σ = 25What sample size is needed to give the desired margin of error in estimating a population mean with the indicated level of confidence?
A margin of error within ±1 with 99% confidence, assuming a sample from a similar population had s = 3.4What sample size is needed to give the desired margin of error in estimating a population mean with the indicated level of confidence?
A margin of error within ±5 with 95% confidence, assuming a previous sample had s = 18What sample size is needed to give the desired margin of error in estimating a population mean with the indicated level of confidence?
A 99% confidence interval for μ using the sample results x̅ = 88.3, s = 32.1, and n = 15Use the t-distribution to find a confidence interval for a mean μ given the relevant sample results. Give the best point estimate for μ, the margin of error, and the confidence interval. Assume the results
A 99% confidence interval for μ using the sample results x̅ = 46.1, s = 12.5, and n = 10Use the t-distribution to find a confidence interval for a mean μ given the relevant sample results. Give the best point estimate for μ, the margin of error, and the confidence interval. Assume the results
A 90% confidence interval for μ using the sample results x̅ = 137.0, s = 53.9, and n = 50Use the t-distribution to find a confidence interval for a mean μ given the relevant sample results. Give the best point estimate for μ, the margin of error, and the confidence interval. Assume the results
A 90% confidence interval for μ using the sample results x̅ = 3.1, s = 0.4, and n = 100Use the t-distribution to find a confidence interval for a mean μ given the relevant sample results. Give the best point estimate for μ, the margin of error, and the confidence interval. Assume the results
A 95% confidence interval for μ using the sample results x̅ = 84.6, s = 7.8, and n = 42Use the t-distribution to find a confidence interval for a mean μ given the relevant sample results. Give the best point estimate for μ, the margin of error, and the confidence interval. Assume the results
A 95% confidence interval for μ using the sample results x̅ = 12.7, s = 5.6, and n = 30Use the t-distribution to find a confidence interval for a mean μ given the relevant sample results. Give the best point estimate for μ, the margin of error, and the confidence interval. Assume the
The AllCountries dataset includes land area, in square kilometers, for all 213 countries in the world. The mean land area for all the countries is 608,120 sq km with standard deviation 1,766,860. For samples of size 50, what percentage of sample means will be less than 400,000 sq km? What
Exercise 6.89 describes scores on the Critical Reading portion of the Scholastic Aptitude Test (SAT) for college-bound students in the class of 2010. Critical Reading scores are approximately normally distributed with mean μ = 501 and standard deviation σ = 112.(a) For each sample size below, use
Most IQ tests scale the scores so that the mean IQ score is μ = 100 and standard deviation is σ = 15. Suppose that 30 fourth graders in one class are given such an IQ test that is appropriate for their grade level. If the students are really a random sample of all fourth graders, what is the
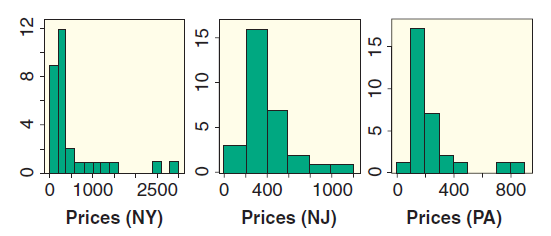
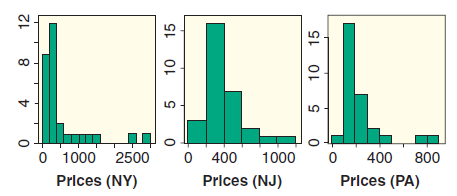
Answer the same questions using Figure 6.10 as in Exercise 6.100 except assume that each histogram represents only 15 homes. Is the t-distribution appropriate to model sample means of housing price from New York? New Jersey? Pennsylvania?Figure 6.10 LII O 1000 0 400 400 2500 1000 800 Prices (NY)
The dataset HomesForSale has data on price in thousands of dollars for houses for sale in three Mid-Atlantic states (NY, NJ, and PA). Figure 6.10 shows a histogram for a random sample of the asking price for 30 homes in each state. Is the t-distribution appropriate to model sample means of our
Mean body temperature, in ◦F, using the data in BodyTemp50 with n = 50, x̅ = 98.26, and s = 0.765Use StatKey or other technology to generate a bootstrap distribution of sample means and find the standard error for that distribution. Compare the result to the standard error given by the Central
Mean price of used Mustang cars online (in $1000s) using the data in MustangPrice with n = 25, x̅ = 15.98, and s = 11.11Use StatKey or other technology to generate a bootstrap distribution of sample means and find the standard error for that distribution. Compare the result to the standard error
Mean commute time in Atlanta, in minutes, using the data in CommuteAtlanta with n = 500, x̅ = 29.11, and s = 20.72Use StatKey or other technology to generate a bootstrap distribution of sample means and find the standard error for that distribution. Compare the result to the standard error given
Mean number of penalty minutes for NHL players using the data in Ottawa Senators with n = 24, x̅ = 49.58, and s = 49.14Use StatKey or other technology to generate a bootstrap distribution of sample means and find the standard error for that distribution. Compare the result to the standard error
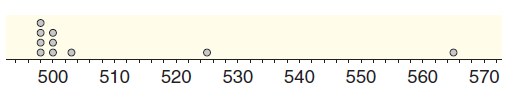
Asample with n = 10, xÌ… = 508.5, and s = 21.5We give summary statistics and a dotplot for a sample. In each case, indicate whether or not it is appropriate to use the t-distribution. If it is appropriate, give the degrees of freedom for the t-distribution and give the estimated
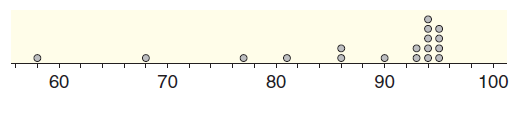
A sample with n = 18, xÌ… = 87.9, and s = 10.6We give summary statistics and a dotplot for a sample. In each case, indicate whether or not it is appropriate to use the t-distribution. If it is appropriate, give the degrees of freedom for the t-distribution and give the estimated
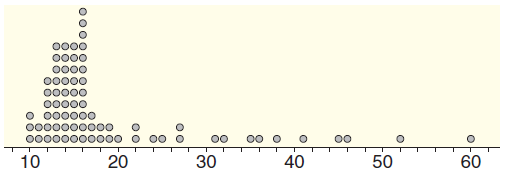
A sample with n = 75, xÌ… = 18.92, and s = 10.1We give summary statistics and a dotplot for a sample. In each case, indicate whether or not it is appropriate to use the t-distribution. If it is appropriate, give the degrees of freedom for the t-distribution and give the estimated
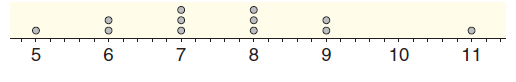
A sample with n = 12, xÌ… = 7.6, and s = 1.6We give summary statistics and a dotplot for a sample. In each case, indicate whether or not it is appropriate to use the t-distribution. If it is appropriate, give the degrees of freedom for the t-distribution and give the estimated standard
Compute the standard error for sample means from populations all with mean μ = 100 and with standard deviations σ = 5, σ = 25, and σ = 75 using a sample size of n = 100. Discuss the effect of the population standard deviation on the standard error of the sample means.
Compute the standard error for sample means from a population with mean μ = 100 and standard deviation σ = 25 for sample sizes of n = 30, n = 200, and n = 1000. What effect does increasing the sample size have on the standard error? Using this information about the effect on the standard error,
The Critical Reading portion of the Scholastic Aptitude Test (SAT) was taken by 1,547,990 college bound students in the class of 2010. Scores on that portion of the test range from 200 to 800 and the average score for the class of 2010 is 501 with a standard deviation of 112. Scores are
For the class of 2010, the average score on the Writing portion of the SAT (Scholastic Aptitude Test) is 492 with a standard deviation of 111. Find the mean and standard deviation of the distribution of mean scores if we take random samples of 1000 scores at a time and compute the sample means.
For the class of 2010, the average score on the Mathematics portion of the SAT (Scholastic Aptitude Test) is 516 with a standard deviation of 116. Find the mean and standard deviation of the distribution of mean scores if we take random samples of 100 scores at a time and compute the sample
The All Countries dataset includes land area, in square kilometers, for all 213 countries in the world. The median land area for all the countries is 94,080 sq km and the mean is 608,120 sq km with standard deviation 1,766,860.(a) How is it possible for the mean and the median to be so different?
Choose one of the following datasets: USStates, StudentSurvey, AllCountries, or NBAPlayers2011, and then select any two quantitative variables that we have not yet analyzed. Use technology to create a scatterplot of the two variables with the regression line on it and discuss what you see. If there
Sample proportions of sample size n = 100 from a population with p = 0.4Find the mean and standard error of the sample proportions two ways:(a) Use StatKey or other technology to simulate at least 1000 sample proportions. Give the mean and standard error and comment on whether the distribution
Proportion of home team wins in soccer, using p̂ = 0.583 with n = 120Find a 95% confidence interval for the proportion two ways, using StatKey or other technology and percentiles from a bootstrap distribution and using the normal distribution and the formula for standard error. Compare the results.
Proportion of Reese’s Pieces that are orange, using p̂ = 0.48 with n = 150Find a 95% confidence interval for the proportion two ways, using StatKey or other technology and percentiles from a bootstrap distribution and using the normal distribution and the formula for standard error. Compare the
Find the sample size needed to give, with 95% confidence, a margin of error within±6%when estimating a proportion. Within ±4%. Within ±1%. (Assume no prior knowledge about the population proportion p.) Comment on the relationship between the sample size and the desired margin of error.We examine
Find the sample size needed to give a margin of error to estimate a proportion within ±3% with 99% confidence. With 95% confidence. With 90% confidence. (Assume no prior knowledge about the population proportion p.) Comment on the relationship between the sample size and the confidence level
Find the sample size needed to give, with 95% confidence, a margin of error within ±3% when estimating a proportion. First, find the sample size needed if we have no prior knowledge about the population proportion p. Then find the sample size needed if we have reason to believe that p ≈ 0.7.
A survey of 1000 adults in the US conducted in March 2011 asked ‘‘Do you favor or oppose ‘sin taxes’ on soda and junk food?” The proportion in favor of taxing these foods was 32%.(a) Find a 95% confidence interval for the proportion of US adults favoring taxes on soda and junk food.(b)
A survey is planned to estimate the proportion of voters who support a proposed gun control law. The estimate should be within a margin of error of ±2% with 95% confidence, and we do not have any prior knowledge about the proportion who might support the law. How many people need to be included in
An advertising firm plans to have a sample of individuals view a commercial on a ‘‘sunscreen pill” that one can swallow to provide mild SPF protection throughout the day. After viewing the commercial, each individual will be asked if he/she would consider buying the product. How many
In April 2012, the Gallup Poll reported that in a random sample of 1016 US adults, only 17% approve of the way Congress is handling its job.(a) Use the poll results to estimate the proportion of all US adults who approve of the way Congress is doing its job. What is the margin of error, with 99%
One of the variables in the dataset CommuteAtlanta, introduced in Data 3.3 on page 193, gives the sex of each commuter in the sample. Use technology and the dataset to construct and interpret a 95% confidence interval for the proportion of Atlanta commuters who are male.Data 3.3 on page 193What is
The dataset ICU-Admissions, introduced in Data 2.3 on page 66, includes information on 200 patients admitted to an Intensive Care Unit. One of the variables, Status, indicates whether each patient lived (indicated with a 0) or died (indicated with a 1). Use technology and the dataset to construct
As of 2011, Division I college football in the US does not have a tournament-style playoff to pick a national champion. In a random survey conducted by Quinnipiac University, people who identified themselves as college football fans were asked if they favor a playoff system, similar to college
Determine whether it is appropriate to use the normal distribution to estimate the p-value. If it is appropriate, use the normal distribution and the given sample results to complete the test of the given hypotheses. Assume the results come from a random sample and use a 5% significance level.Test
Determine whether it is appropriate to use the normal distribution to estimate the p-value. If it is appropriate, use the normal distribution and the given sample results to complete the test of the given hypotheses. Assume the results come from a random sample and use a 5% significance level.Test
Determine whether it is appropriate to use the normal distribution to estimate the p-value. If it is appropriate, use the normal distribution and the given sample results to complete the test of the given hypotheses. Assume the results come from a random sample and use a 5% significance level.Test
Determine whether it is appropriate to use the normal distribution to estimate the p-value. If it is appropriate, use the normal distribution and the given sample results to complete the test of the given hypotheses. Assume the results come from a random sample and use a 5% significance level.Test
Determine whether it is appropriate to use the normal distribution to estimate the p-value. If it is appropriate, use the normal distribution and the given sample results to complete the test of the given hypotheses. Assume the results come from a random sample and use a 5% significance level.Test
Determine whether it is appropriate to use the normal distribution to estimate the p-value. If it is appropriate, use the normal distribution and the given sample results to complete the test of the given hypotheses. Assume the results come from a random sample and use a 5% significance level.Test
Approximately 10% of Americans are left-handed (we will treat this as a known population parameter). A study on the relationship between handedness and profession found that in a random sample of 105 lawyers, 16 of them were left-handed. Test the hypothesis that the proportion of left-handed
A telephone survey of 1000 randomly selected US adults found that 31% of them say they believe in ghosts. Does this provide evidence that more than 1 in 4 US adults believe in ghosts? Clearly show all details of the test.
There were 2430 Major League Baseball (MLB) games played in 2009, and the home team won the game in 54.9% of the games. If we consider the games played in 2009 as a sample of all MLB games, test to see if there is evidence, at the 1% level, that the home team wins more than half the games. Show all
The percent of US adults who know their neighbors appears to be trending up. A survey of 2255 randomly selected US adults conducted in November 2010 found that 51% said they know all or most of their neighbors. (The result in a similar survey conducted in 2008 was 40%.) Does the 2010 survey provide
Multiple-choice questions on Advanced Placement exams have five options: A, B, C, D, and E. A random sample of the correct choice on 400 multiple-choice questions on a variety of AP exams shows that B was the most common correct choice, with 90 of the 400 questions having B as the answer. Does this
In Example 2.6 on page 51 we consider a survey of students who were asked to choose an award they would like to win from among an Academy Award, Nobel Prize, and Olympic gold medal. If the awards are equally popular we would expect about 1/3 to choose each type of award. In one sample of 169 female
In Data 4.1 on page 220 we consider an experiment to see if dogs tend to resemble their owners. In the study, 16 of 25 dogs were correctly matched with the owner when two choices were provided. To see if that is more than we would expect by random chance alone, we test H0: p = 0.5 vs Ha: p >
In Exercise 4.40 on page 236, we introduce a series of Euchre games played between two teams: Team A and Team B. After 40 games, Team A has won 16 times and Team B has won 24 times. Can we conclude that one team is better than the other? Use the normal approximation to test this. Clearly state the
The data in Nutrition- Study, introduced in Exercise 1.13 on page 13, include information on nutrition and health habits of a sample of 315 people. One of the variables is Smoke, indicating whether a person smokes or not (yes or no). Use technology to test whether the data provide evidence that the
The data in NutritionStudy, introduced in Exercise 1.13 on page 13, include information on nutrition and health habits of a sample of 315 people. One of the variables is VitaminUse, indicating whether a person takes a multivitamin pill regularly or occasionally or not at all. Use technology to test
Samples of size 1000 from a population with mean 28 and standard deviation 5If random samples of the given size are drawn from a population with the given mean and standard deviation:(a) Find the mean and standard error of the distribution of sample means.(b) If the sample size is large enough for
Samples of size 10 from a population with mean 6 and standard deviation 2If random samples of the given size are drawn from a population with the given mean and standard deviation:(a) Find the mean and standard error of the distribution of sample means.(b) If the sample size is large enough for the
Samples of size 40 from a population with mean 250 and standard deviation 80If random samples of the given size are drawn from a population with the given mean and standard deviation:(a) Find the mean and standard error of the distribution of sample means.(b) If the sample size is large enough for
Samples of size 75 from a population with mean 60 and standard deviation 32If random samples of the given size are drawn from a population with the given mean and standard deviation:(a) Find the mean and standard error of the distribution of sample means.(b) If the sample size is large enough for
Showing 800 - 900
of 2108
First
2
3
4
5
6
7
8
9
10
11
12
13
14
15
16
Last
Step by Step Answers