New Semester
Started
Get
50% OFF
Study Help!
--h --m --s
Claim Now
Question Answers
Textbooks
Find textbooks, questions and answers
Oops, something went wrong!
Change your search query and then try again
S
Books
FREE
Study Help
Expert Questions
Accounting
General Management
Mathematics
Finance
Organizational Behaviour
Law
Physics
Operating System
Management Leadership
Sociology
Programming
Marketing
Database
Computer Network
Economics
Textbooks Solutions
Accounting
Managerial Accounting
Management Leadership
Cost Accounting
Statistics
Business Law
Corporate Finance
Finance
Economics
Auditing
Tutors
Online Tutors
Find a Tutor
Hire a Tutor
Become a Tutor
AI Tutor
AI Study Planner
NEW
Sell Books
Search
Search
Sign In
Register
study help
mathematics
statistics the art and science
Statistics Unlocking The Power Of Data 1st Edition Robin H. Lock, Patti Frazer Lock, Kari Lock Morgan, Eric F. Lock, Dennis F. Lock - Solutions
Find endpoints of a t-distribution with 5% beyond them in each tail if the sample has size n = 10.Assume the sample is a random sample from a distribution that is reasonably normally distributed and we are doing inference for a sample mean.
Find endpoints of a t-distribution with 1% beyond them in each tail if the sample has size n = 18.Assume the sample is a random sample from a distribution that is reasonably normally distributed and we are doing inference for a sample mean.
Find endpoints of a t-distribution with 0.025 beyond them in each tail if the sample has size n = 25.Assume the sample is a random sample from a distribution that is reasonably normally distributed and we are doing inference for a sample mean.
Find endpoints of a t-distribution with 0.005 beyond them in each tail if the sample has size n = 40.Assume the sample is a random sample from a distribution that is reasonably normally distributed and we are doing inference for a sample mean.
Find the area in a t-distribution above 2.3 if the sample has size n = 6.Assume the sample is a random sample from a distribution that is reasonably normally distributed and we are doing inference for a sample mean.
Find the area in a t-distribution above 1.5 if the sample has size n = 8.Assume the sample is a random sample from a distribution that is reasonably normally distributed and we are doing inference for a sample mean.
Find the area in a t-distribution below −1.0 if the sample has size n = 20.Assume the sample is a random sample from a distribution that is reasonably normally distributed and we are doing inference for a sample mean.
Find the area in a t-distribution below −3.2 if the sample has size n = 50.Assume the sample is a random sample from a distribution that is reasonably normally distributed and we are doing inference for a sample mean.
From the US Census, we learn that the average age of all US residents is 36.78 years with a standard deviation of 22.58 years. Find the mean and standard deviation of the distribution of sample means for age if we take random samples of US residents of size:(a) n = 10(b) n = 100(c) n = 1000
The Boston Marathon is the world’s oldest annual marathon, held every year since 1897. In 2011, 23,879 runners finished the race, with a mean time for all runners of 3:49:54 (about 230 minutes) with standard deviation 0:37:56 (about 38 minutes). Find the mean and standard deviation (in minutes)
Samples of size 50 from a population with proportion 0.25.If random samples of the given size are drawn from a population with the given proportion:(a) Find the mean and standard error of the distribution of sample proportions.(b) If the sample size is large enough for the Central Limit Theorem to
Samples of size 1000 from a population with proportion 0.70.If random samples of the given size are drawn from a population with the given proportion:(a) Find the mean and standard error of the distribution of sample proportions.(b) If the sample size is large enough for the Central Limit Theorem
Samples of size 60 from a population with proportion 0.90.If random samples of the given size are drawn from a population with the given proportion:(a) Find the mean and standard error of the distribution of sample proportions.(b) If the sample size is large enough for the Central Limit Theorem to
Samples of size 30 from a population with proportion 0.27.If random samples of the given size are drawn from a population with the given proportion:(a) Find the mean and standard error of the distribution of sample proportions.(b) If the sample size is large enough for the Central Limit Theorem to
Samples of size 300 from a population with proportion 0.08.If random samples of the given size are drawn from a population with the given proportion:(a) Find the mean and standard error of the distribution of sample proportions.(b) If the sample size is large enough for the Central Limit Theorem to
Samples of size 100 from a population with proportion 0.41.If random samples of the given size are drawn from a population with the given proportion:(a) Find the mean and standard error of the distribution of sample proportions.(b) If the sample size is large enough for the Central Limit Theorem to
India has over 600 million mobile phone subscribers. The largest company providing mobile phone service is Bharti Airtel, which has 30% of the market share. If random samples of 500 mobile phone subscribers in India are selected and we compute the proportion using service from Bharti Airtel,
In the class of 2010, 25% of students taking the Mathematics portion of the SAT (Scholastic Aptitude Test) scored over a 600. If we take random samples of 100 members of the class of 2010 and compute the proportion who got over a 600 on the Math SAT for each sample, what will be the mean and
The 2010 US Census reports that, of all the nation’s occupied housing units, 65.1% are owned by the occupants and 34.9% are rented. If we take random samples of 50 occupied housing units and compute the sample proportion that are owned for each sample, what will be the mean and standard deviation
Usually, in sports, we expect top athletes to get better over time. Weexpect future athletes to run faster, jump higher, throw farther. One thing has remained remarkably constant, however. The percent of free throws made by basketball players has stayed almost exactly the same for 50 years. For
Compute the standard error for sample proportions from a population with proportion p = 0.4 for sample sizes of n = 30, n = 200, and n = 1000. What effect does increasing the sample size have on the standard error? Using this information about the effect on the standard error, discuss the effect of
Compute the standard error for sample proportions from a population with proportions p = 0.8, p = 0.5, p = 0.3, and p = 0.1 using a sample size of n = 100. Comment on what you see. For which proportion is the standard error the greatest? For which is it the smallest?
In each case below, does the Central Limit Theorem apply?(a) n = 500 and p = 0.1(b) n = 25 and p = 0.5(c) n = 30 and p = 0.2(d) n = 100 and p = 0.92Indicate whether the Central Limit Theorem applies so that the sample proportions follow a normal distribution.
In each case below, does the Central Limit Theorem apply?(a) n = 80 and p = 0.1(b) n = 25 and p = 0.8(c) n = 50 and p = 0.4(d) n = 200 and p = 0.7Indicate whether the Central Limit Theorem applies so that the sample proportions follow a normal distribution.
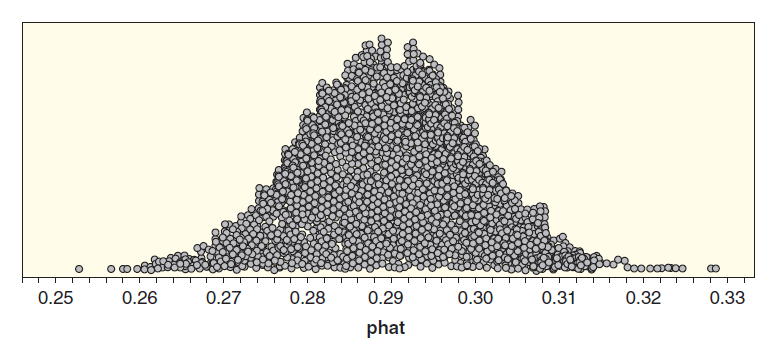
Sample proportions of sample size n = 50 from a population with p = 0.25Find the mean and standard error of the sample proportions two ways:(a) Use StatKey or other technology to simulate at least 1000 sample proportions. Give the mean and standard error and comment on whether the distribution
Sample proportions of sample size n = 40 from a population with p = 0.5Find the mean and standard error of the sample proportions two ways:(a) Use StatKey or other technology to simulate at least 1000 sample proportions. Give the mean and standard error and comment on whether the distribution
Sample proportions of sample size n = 10 from a population with p = 0.2Find the mean and standard error of the sample proportions two ways:(a) Use StatKey or other technology to simulate at least 1000 sample proportions. Give the mean and standard error and comment on whether the distribution
Proportion of peanuts in mixed nuts, with n = 100 and p̂ = 0.52Use StatKey or other technology to generate a bootstrap distribution of sample proportions and find the standard error for that distribution. Compare the result to the standard error given by the Central Limit Theorem, using the sample
Proportion of home team wins in soccer, with n = 120 and p̂ = 0.583Use StatKey or other technology to generate a bootstrap distribution of sample proportions and find the standard error for that distribution. Compare the result to the standard error given by the Central Limit Theorem, using the
Proportion of lie detector trials in which the technology misses a lie, with n = 48 and p̂ = 0.354Use StatKey or other technology to generate a bootstrap distribution of sample proportions and find the standard error for that distribution. Compare the result to the standard error given by the
Proportion of survey respondents who say exercise is important, with n = 1000 and p̂ = 0.753Use StatKey or other technology to generate a bootstrap distribution of sample proportions and find the standard error for that distribution. Compare the result to the standard error given by the Central
The data in All-Countries include information for all of the countries of the world, but some of the variables have missing data because values weren’t available for some countries. For example, there are values for Energy use in only 136 of the 213 countries (64%). Suppose students select random
Example 6.2 on page 355 reports data from the Bureau of Transportation Statistics that 80% of flights at a particular airline arrive on time (defined as within 15 minutes of the scheduled arrival time). Use the results in Example 6.2 to determine how likely it is that the ontime proportion for a
In Exercise 6.10, we learn that the percent of free throws made in the NBA (National Basketball Association) has been about 75% for the last 50 years. If we take random samples of free throws in the NBA and compute the proportion of free throws made, what percent of samples of size n = 200 will
A 95% confidence interval for p given that p̂ = 0.38 and n = 500Use the normal distribution to find a confidence interval for a proportion p given the relevant sample results. Give the best point estimate for p, the margin of error, and the confidence interval. Assume the results come from a
A 90% confidence interval for p given that p̂ = 0.85 and n = 120Use the normal distribution to find a confidence interval for a proportion p given the relevant sample results. Give the best point estimate for p, the margin of error, and the confidence interval. Assume the results come from a
A 99% confidence interval for the proportion who will answer ‘‘Yes” to a question, given that 62 answered yes in a random sample of 90 peopleUse the normal distribution to find a confidence interval for a proportion p given the relevant sample results. Give the best point estimate for p, the
A 95% confidence interval for the proportion of the population in Category A given that 23% of a sample of 400 are in Category AUse the normal distribution to find a confidence interval for a proportion p given the relevant sample results. Give the best point estimate for p, the margin of error,
Amargin of error within ±5% with 95% confidence.What sample size is needed to give the desired margin of error in estimating a population proportion with the indicated level of confidence?
Amargin of error within ±1% with 99% confidence.What sample size is needed to give the desired margin of error in estimating a population proportion with the indicated level of confidence?
A margin of error within ±3% with 90% confidence. We estimate that the population proportion is about 0.3.What sample size is needed to give the desired margin of error in estimating a population proportion with the indicated level of confidence?
A margin of error within ±2% with 95% confidence. An initial small sample has p̂ = 0.78.What sample size is needed to give the desired margin of error in estimating a population proportion with the indicated level of confidence?
In a survey of 1000 US adults, twenty percent say they never exercise. This is the highest level seen in five years. Find and interpret a 99% confidence interval for the proportion of US adults who say they never exercise. What is the margin of error, with 99% confidence?
In analyzing data from over 700 games in the National Football League, economist David Romer identified 1068 fourth-down situations in which, based on his analysis, the right call would have been to go for it and not to punt. Nonetheless, in 959 of those situations, the teams punted. Find and
In a nationwide poll of 1000 randomly sampled adults conducted in June 2011, 83% said they think children spend too much time on their computers and other electronic devices (but 37% say time spent on a computer is better than time spent in front of a TV). Find and interpret a 95% confidence
Data 2.1 on page 46 deals with a survey that asked whether people agree or disagree with the statement ‘‘There is only one true love for each person.” The survey results in Table 2.1 show that 735 of the 2625 respondents agreed, 1812 disagreed, and 78 answered ‘‘don’t know.”Table
There were 2430 Major League Baseball (MLB) games played in 2009, and the home team won in 54.9% of the games. If we consider the games played in 2009 as a sample of all MLB games, find and interpret a 90% confidence interval for the proportion of games the home team wins in Major League Baseball.
In a survey of 2255 randomly selected US adults (age 18 or older), 1787 of them use the Internet regularly. Of the Internet users, 1054 use a social networking site. Find and interpret a 95% confidence interval for each of the following proportions:(a) Proportion of US adults who use the Internet
In the survey of 2255 US adults described in Exercise 6.39, we also learn that 970 of the respondents use the social networking site Facebook. Of the 970 Facebook users, the survey shows that on an average day: • 15% update their status• 22% comment on another’s post or status• 20%
In a Nielsen global online survey of about 27,000 people from 53 different countries, 61% of consumers indicated that they purchased more store brands during the economic downturn and 91% indicated that they will continue to purchase the same number of store brands when the economy improves. The
A survey of 15,000 American adults in March 2011 found that 35.3% identify as Democrats and 34.0% identify as Republicans, with the rest identifying as independent or other. If we want 95% confidence, what is the margin of error in the estimate for the proportion of Democrats? For the proportion of
A little more than a year earlier than the survey described in Exercise 6.42, in February 2010, a different survey of 15,000 American adults found that 35.1% identified as Democrats and 32.1% identified as Republicans, with the rest identifying as independent or other. Answer the same questions
Cognitive science consistently shows that one of the most effective studying tools is to self-test. A recent study reinforced this finding. In the study, 118 college students studied 48 pairs of Swahili and English words. All students had an initial study time and then three blocks of practice
Match the scatterplots in Figure 2.55 with the correlation values.Figure 2.55r = ˆ’0.81 Scatter Plot Scatter Plot 4 Scatter Plot + Scatter Plot -1 -1 -1 -1 -2 -2 -2 -2 -2 -1 -2 -1 -2 -1 -1 -2 х (a) (b) (c) (d)
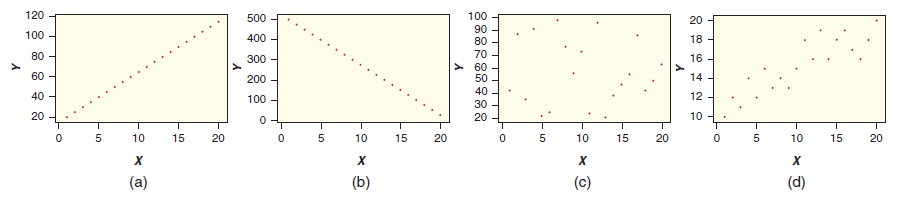
Match the scatterplots in Figure 2.54 with the correlation values.Figure 2.54r = 1 120 100 90 80 500 20 100 - 400 - 18 80 - 300 - 16 > 60 60 - 40 - 20 - 14 - 200 100 40 30 20 12 10 10 15 20 10 20 15 20 10 20 15 10 15 (d) (a) (b) (c) 원은 is -은 ×으
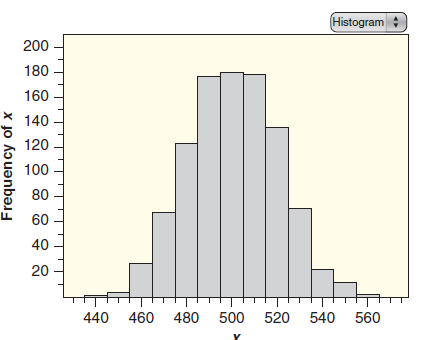
Estimate the mean and the standard deviation for the data in the histogram in Figure 2.25.Estimate the summary statistics requested, using the histogram in Figure 2.25. There are n = 100 data points included in the dotplot.Figure 2.25 Histogram 200 180 160 140 120 100 80 60 40 - 20 560 440 460 480
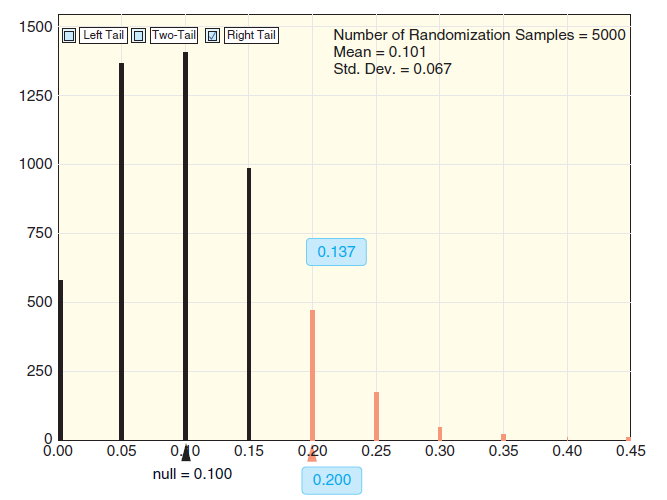
If people choose lottery numbers at random, the last digit should be equally likely to be any of the digits from 0 to 9. Let p measure the proportion of choices that end with the digit 7. If choices are random, we would expect p = 0.10, but if people have a special preference for numbers ending in
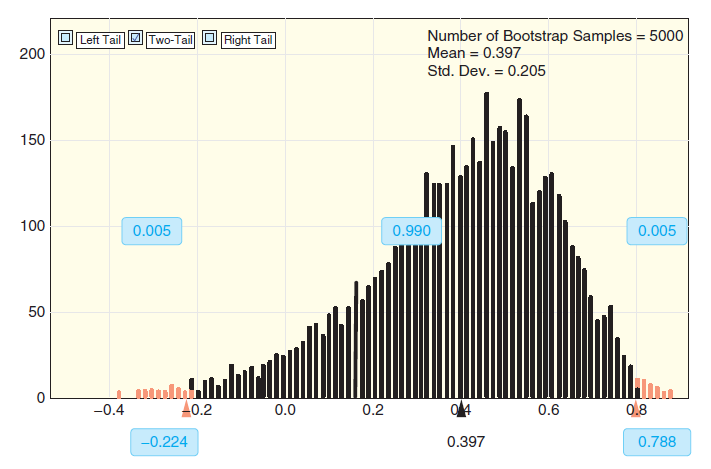
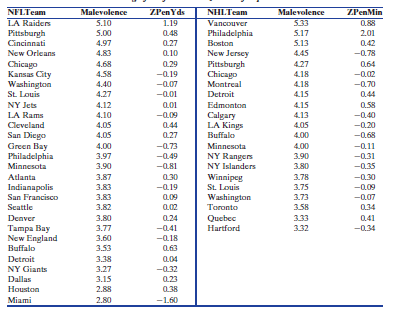
Figure 5.21 shows a bootstrap distribution of correlations between penalty yards and uniform malevolence using the data on 28 NFL teams in Malevolent-UniformsNFL. We see from the percentiles of the bootstrap distribution that a 99% confidence interval for the correlation is ˆ’0.224 to
Suppose that you hold a coin vertically on edge, flick one side to make it spin, then see if it settles on heads or tails. Is this a fair process? That is, will half of spins tend to fall heads and the other half on tails? To investigate this question, a student spun the same US penny 200 times and
Refer to the randomization test described in Exercise 5.72 for the correlation between uniform malevolence and penalty minutes for NHL teams. Suppose that a student constructs randomization samples by scrambling the NHLMalevolence variable in MalevolentUniformsNHL and computing the correlation with
Data 4.3 on page 224 describes a study of a possible relationship between the perceived malevolence of a team€™s uniform and penalties called against the team. In Exercise 4.133 on page 279 we consider a randomization distribution to test for a positive correlation for National Hockey
In 2010, some researchers with the Pew Internet & American Life project interviewed a random sample of adults about their cell phone usage. One of the questions asked was whether the respondent had ever downloaded an application or €˜€˜app€ to their cell phone.
In Exercise 3.85 on page 204, we find an interval estimate for the correlation between Distance (in miles) and Time (in minutes) for Atlanta commuters, based on the sample of size n = 500 in CommuteAtlanta. The correlation in the original sample is r = 0.807. The file BootAtlanta- Corr contains
Data 3.4 on page 209 describes a sample of n = 25 Mustang cars being offered for sale on the Internet. The data are stored in MustangPrice, and we want to predict the Price of each car (in $1000s) based on the Miles it has been driven (also in 1000s).(a) Find the slope of the regression line for
Data 3.4 on page 209 describes a sample of n = 25 Mustang cars being offered for sale on the Internet. Use the data in Mustang Price to construct a 95% confidence interval to estimate the mean Price (in $1000s) for the population of all such Mustangs. Find the 95% confidence interval two ways:(a)
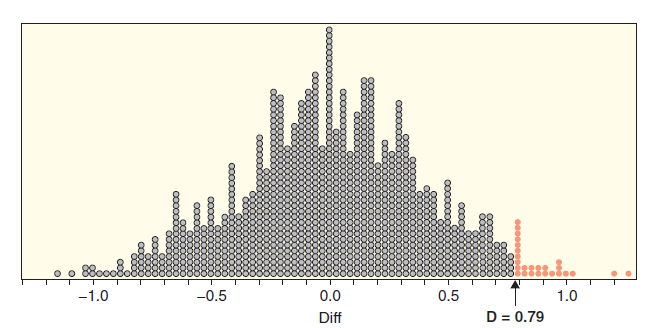
Data 4.2 on page 223 describes an experiment to study the effects of smiling on leniency in judging students accused of cheating. Exercise 4.60 on page 250 shows a dotplot, reproduced in Figure 5.19, of a randomization distribution of differences in sample means. The relevant hypotheses are H0:
The dataset Exercise- Hours contains information on the amount of exercise (hours per week) for a sample of statistics students. The mean amount of exercise was 9.4 hours for the 30 female students in the sample and 12.4 hours for the 20 male students. A randomization distribution of differences in
In a survey of 1000 American adults conducted in April 2012, 43% reported having gone through an entire week without paying for anything in cash. Test to see if this sample provides evidence that the proportion of all American adults going a week without paying cash is greater than 40%. Use the
A study of 138 penalty shots in World Cup Finals games between 1982 and 1994 found that the goalkeeper correctly guessed the direction of the kick only 41% of the time. The article notes that this is ‘‘slightly worse than random chance.” We use these data as a sample of all World Cup penalty
In Exercise 5.62, we see that students who study by giving themselves quizzes recall a greater proportion of words than students who study by reading. In Exercise 5.62 we see that there is an effect, but often the question of interest is not ‘‘Is there an effect?” but instead ‘‘How big is
Hospital admissions for asthma in children younger than 15 years was studied in Scotland both before and after comprehensive smoke-free legislation was passed in March 2006. Monthly records were kept of the annualized percent change in asthma admissions, both before and after the legislation was
The ICU Admissions dataset includes a variable indicating the age of the patient. Find and interpret a 95% confidence interval for mean age of ICU patients using the facts that, in the sample, the mean is 57.55 years and the standard error for such means is SE = 1.42. The sample size of 200 is
A survey of 1000 air travelers found that 60% prefer a window seat. The sample size is large enough to use the normal distribution, and a bootstrap distribution shows that the standard error is SE = 0.015. Use a normal distribution to find and interpret a 99% confidence interval for the proportion
A recent study found that, of the 1771 participants aged 12 to 19 in the National Health and Nutrition Examination Survey, 19.5% had some hearing loss (defined as a loss of 15 decibels in at least one ear). This is a dramatic increase from a decade ago. The sample size is large enough to use the
(a) z = −1.08 for a lower tail test for a mean(b) z = 4.12 for an upper tail test for a proportion(c) z = −1.58 for a two-tailed test for a slopeFind the p-value based on a standard normal distribution for each of the following standardized test statistics.
(a) z = 0.84 for an upper tail test for a difference in two proportions(b) z = −2.38 for a lower tail test for a difference in two means(c) z = 2.25 for a two-tailed test for a correlationFind the p-value based on a standard normal distribution for each of the following standardized test
Test H0: μ1 = μ2 vs Ha: μ1 > μ2 when the samples have n1 = n2 = 50, x̅1 = 35.4, x̅2 = 33.1, s1 = 1.28, and s2 = 1.17. The standard error of x̅1 − x̅2 from the randomization distribution is 0.25.Include a set of hypotheses, some information from one or more samples, and a standard error
Test H0: p1 = p2 vs Ha: p1 < p2 when the samples have n1 = 150 with p̂1 = 0.18 and n2 = 100 with p̂2 = 0.23. The standard error of p̂1 − p̂2 from the randomization distribution is 0.05.Include a set of hypotheses, some information from one or more samples, and a standard error from a
Test H0: μ = 10 vs Ha: μ ≠ 10 when the sample has n = 75, x̅ = 11.3, and s = 0.85, with SE = 0.10.Include a set of hypotheses, some information from one or more samples, and a standard error from a randomization distribution. Find the value of the standardized z-test statistic in each
Test H0: p = 0.5 vs Ha: p ≠ 0.5 when the sample has n = 50 and p̂ = 0.41, with SE = 0.07.Include a set of hypotheses, some information from one or more samples, and a standard error from a randomization distribution. Find the value of the standardized z-test statistic in each situation.
Test H0: p = 0.25 vs Ha: p < 0.25 when the sample has n = 800 and p̂ = 0.235, with SE = 0.018.Include a set of hypotheses, some information from one or more samples, and a standard error from a randomization distribution. Find the value of the standardized z-test statistic in each situation.
Test H0: μ = 80 vs Ha: μ > 80 when the sample has n = 20, x̅ = 82.4, and s = 3.5, with SE = 0.8.Include a set of hypotheses, some information from one or more samples, and a standard error from a randomization distribution. Find the value of the standardized z-test statistic in each situation.
A 95% confidence interval for a difference in means μ1 − μ2 if the samples have n1 = 100 with x̅1 = 256 and s = 51 and n2 = 120 with x̅ = 242 and s = 47, and the standard error is SE = 6.70Find the indicated confidence interval. Assume the standard error comes from a bootstrap distribution
A 95% confidence interval for a difference in proportions p1 − p2 if the samples have n1 = 50 with p̂1 = 0.68 and n2 = 80 with p̂2 = 0.61, and the standard error is SE = 0.085Find the indicated confidence interval. Assume the standard error comes from a bootstrap distribution that is
A 99% confidence interval for a proportion p if the sample has n = 200 with p̂ = 0.78, and the standard error is SE = 0.03Find the indicated confidence interval. Assume the standard error comes from a bootstrap distribution that is approximately normally distributed.
A 90% confidence interval for a mean μ if the sample has n = 30 with x̅ = 23.1 and s = 5.7, and the standard error is SE = 1.04Find the indicated confidence interval. Assume the standard error comes from a bootstrap distribution that is approximately normally distributed.
A 95% confidence interval for a mean μ if the sample has n = 50 with x̅ = 72 and s = 12, and the standard error is SE = 1.70Find the indicated confidence interval. Assume the standard error comes from a bootstrap distribution that is approximately normally distributed.
A 95% confidence interval for a proportion p if the sample has n = 100 with p̂ = 0.43, and the standard error is SE = 0.05Find the indicated confidence interval. Assume the standard error comes from a bootstrap distribution that is approximately normally distributed.
(a) An 86% confidence interval for a correlation(b) A 94% confidence interval for a difference in proportions(c) A 96% confidence interval for a proportionFind the z∗ values based on a standard normal distribution for each of the following.
(a) An 80% confidence interval for a proportion(b) An 84% confidence interval for a slope(c) A 92% confidence interval for a standard deviationFind the z∗ values based on a standard normal distribution for each of the following.
Pick any positive values for the mean and the standard deviation of a normal distribution. Use your selection of a normal distribution to answer the questions below. The results of parts (a) to (c) form what is often called the Empirical Rule for the standard deviation in a normal distribution.(a)
A statistics instructor designed an exam so that the grades would be roughly normally distributed with mean μ = 75 and standard deviation σ = 10. Unfortunately, a fire alarm with ten minutes to go in the exam made it difficult for some students to finish. When the instructor graded the exams, he
Exam grades across all sections of introductory statistics at a large university are approximately normally distributed with a mean of 72 and a standard deviation of 11. Use the normal distribution to answer the following questions.(a) What percent of students scored above a 90?(b) What percent of
A randomization distribution is created to test a null hypothesis that the slope of a regression line is zero. The randomization distribution of sample slopes follows a normal distribution, centered at zero, with a standard deviation of 2.5.(a) Draw a rough sketch of this randomization
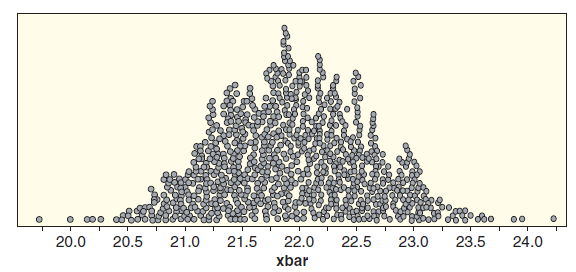
A distribution of bootstrap means for commuting times in St. Louis is given in Figure 5.13. As in Exercise 5.36, we use a N(21.97, 0.65) distribution as a reasonable model for these bootstrap means. Find the first and third quartiles of this normal distribution. That is, find a time (Q1) where
A bootstrap distribution of mean commute times (in minutes) based on a sample of 500 St. Louis workers stored in CommuteStLouis is shown in Figure 5.13. The pattern in this dotplot is reasonably bell-shaped so we use a normal curve to model this distribution of bootstrap means. The mean for this
Heights of adult males in the US are approximately normally distributed with mean 70 inches (5 ft 10 in) and standard deviation 3 inches.(a) What proportion of US men are between 5 ft 8 in and 6 ft tall (68 and 72 inches, respectively)?(b) If a man is at the 10th percentile in height, how tall is
Heights of 10-year-old boys (5th graders) follow an approximate normal distribution with mean μ = 55.5 inches and standard deviation σ = 2.7 inches.(a) Draw a sketch of this normal distribution and label at least three points on the horizontal axis.(b) According to this normal distribution, what
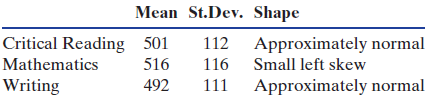
In Table 5.1 with Exercise 5.30, we see that scores on the Writing portion of the SAT (Scholastic Aptitude Test) exam are normally distributed with mean 492 and standard deviation 111. Use the normal distribution to answer the following questions:(a) What is the estimated percentile for a student
In Table 5.1 with Exercise 5.30, we see that scores on the Critical Reading portion of the SAT (Scholastic Aptitude Test) exam are normally distributed with mean 501 and standard deviation 112. Use the normal distribution to answer the following questions:(a) What is the estimated percentile for a
Showing 900 - 1000
of 2108
First
3
4
5
6
7
8
9
10
11
12
13
14
15
16
17
Last
Step by Step Answers