New Semester
Started
Get
50% OFF
Study Help!
--h --m --s
Claim Now
Question Answers
Textbooks
Find textbooks, questions and answers
Oops, something went wrong!
Change your search query and then try again
S
Books
FREE
Study Help
Expert Questions
Accounting
General Management
Mathematics
Finance
Organizational Behaviour
Law
Physics
Operating System
Management Leadership
Sociology
Programming
Marketing
Database
Computer Network
Economics
Textbooks Solutions
Accounting
Managerial Accounting
Management Leadership
Cost Accounting
Statistics
Business Law
Corporate Finance
Finance
Economics
Auditing
Tutors
Online Tutors
Find a Tutor
Hire a Tutor
Become a Tutor
AI Tutor
AI Study Planner
NEW
Sell Books
Search
Search
Sign In
Register
study help
mathematics
statistics the art and science
Statistics Unlocking The Power Of Data 1st Edition Robin H. Lock, Patti Frazer Lock, Kari Lock Morgan, Eric F. Lock, Dennis F. Lock - Solutions
The value 243 in a dataset with mean 200 and standard deviation 25.Find and interpret the z-score for the data value given.
The value 88 in a dataset with mean 96 and standard deviation 10.Find and interpret the z-score for the data value given.
The value 5.2 in a dataset with mean 12 and standard deviation 2.3.Find and interpret the z-score for the data value given.
The value 8.1 in a dataset with mean 5 and standard deviation 2.Find and interpret the z-score for the data value given.
Abell-shaped distribution with mean 200 and standard deviation 25.The 95% rule and the fact that the summary statistics come from a distribution that is symmetric and bell-shaped to find an interval that is expected to contain about 95% of the data values.
A bell-shaped distribution with mean 10 and standard deviation 3.The 95% rule and the fact that the summary statistics come from a distribution that is symmetric and bell-shaped to find an interval that is expected to contain about 95% of the data values.
A bell-shaped distribution with mean 1000 and standard deviation 10.The 95% rule and the fact that the summary statistics come from a distribution that is symmetric and bell-shaped to find an interval that is expected to contain about 95% of the data values.
A bell-shaped distribution with mean 1500 and standard deviation 300.The 95% rule and the fact that the summary statistics come from a distribution that is symmetric and bell-shaped to find an interval that is expected to contain about 95% of the data values.
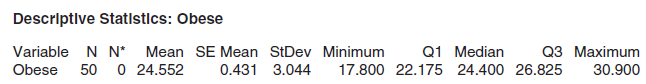
Computer output giving descriptive statistics for the percent of the population that is obese for each of the 50 US states, from the USStates dataset, is given in Figure 2.27. Since all 50 US states are included, this is a population, not a sample.Figure 2.27(a) What are the mean and the standard
Computer output giving descriptive statistics for the percent of the population that is obese for each of the 50 US states, from the USStates dataset, is given in Figure 2.27.Figure 2.27(a) What is the five number summary?(b) Give the range and the IQR.(c) What can we conclude from the five number
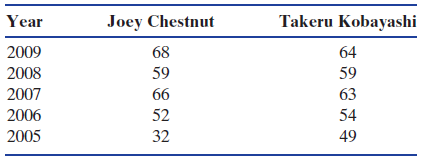
Every Fourth of July, Nathan’s Famous in New York City holds a hot dog eating contest in which contestants try to eat as many hot dogs as possible in 10 minutes. In 2011, over 30,000 people watched the event live on Coney Island, and it was broadcast live to many more on ESPN. The winner in 2011
In Exercise 2.98, we mention that either Joey Chestnut of California, US, or Takeru Kobayashi of Japan has won the Nathan€™s Famous Hot Dog Eating Contest every year from 2002 until 2011. In five of those years, both men competed and the results of the rivalry are shown in Table 2.22.
Studies have shown that heating the scrotum by just 1◦C can reduce sperm count and sperm quality, so men concerned about fertility are cautioned to avoid too much time in the hot tub or sauna. A new study suggests that men also keep their laptop computers off their laps. The study measured
Exercise 1.20 on page 15 gives a sample of eight times, in days, to row solo across the Atlantic Ocean. The times are(a) Use technology to find the mean and standard deviation of the eight times.(b) Find and interpret the z-scores for the longest time and shortest time in the sample.Exercise 1.20
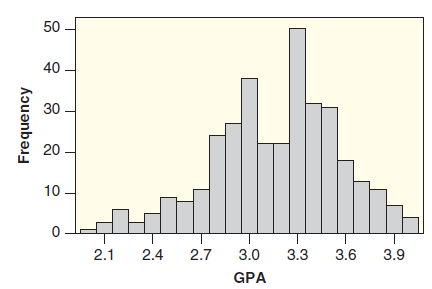
A histogram of the n = 345 grade point averages reported by students in the Student Survey dataset is shown in Figure 2.28.(a) Estimate and interpret the 10th percentile and the 75th percentile.(b) Estimate the range. 50 40 30 20 10 2.4 2.1 2.7 3.0 3.3 3.6 3.9 GPA Frequency
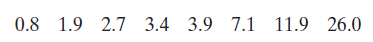
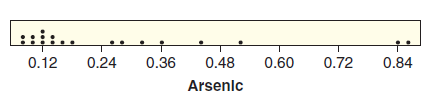
Exercise 2.51 on page 71 discusses the use of toenail clippings to measure the level of arsenic exposure of individuals in Great Britain. A similar study was conducted in the US. Table 2.23 gives toenail arsenic concentrations (in ppm) for 19 individuals with private wells in New Hampshire, and the
Figure 2.29 shows a dotplot of the arsenic concentrations in Table 2.23.Figure 2.29Table 2.23(a) Which measures of center and spread are most appropriate for this distribution: the mean and standard deviation or the five number summary? Explain.(b) Is it appropriate to use the general rule about
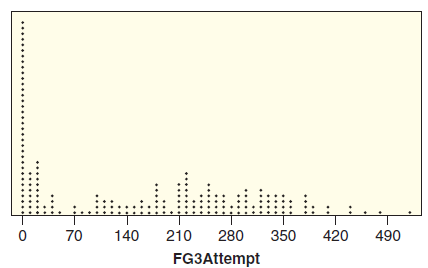
In basketball, a basket is awarded three points (rather than the usual two) if it is shot from farther away. Some players attempt lots of three-point shots and quite a few attempt none, as we see in the distribution of number of three-point attempts by players in the NBA in Figure 2.30. The data
The variable Blocks in the dataset NBA Players 2011 includes information on the number of blocked shots during the season for each of the 176 players in the dataset.(a) Use technology to find the mean and the standard deviation of the number of blocked shots.(b) Use technology to find the five
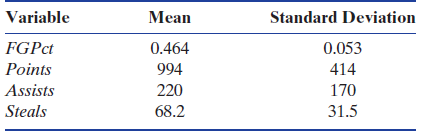
Table 2.24 shows the means and standard deviations for four of the variables in the NBAPlayers2011 dataset. FGPct is the field goal percentage, Points is total number of points scored during the season, Assists is total number of assists during the season, and Steals is total number of steals
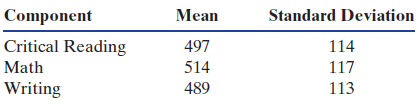
Stanley, a recent high school student, took the SAT exam in 2011 and got a 600 in all three components (Critical Reading, Math, and Writing). He was interested in how well he did compared to the rest of his peers. Table 2.25 shows the summary statistics for all students in 2011.Table 2.25(a)
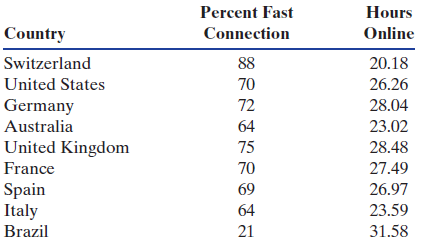
The Nielsen Company measured connection speeds on home computers in nine different countries and wanted to determine whether connection speed affects the amount of time consumers spend online. Table 2.26 shows the percent of Internet users with a €˜€˜fast€ connection
Consider the jogging times from a set of 5-mile runs by two different runners in Table 2.27.Jogger 1......................................Jogger
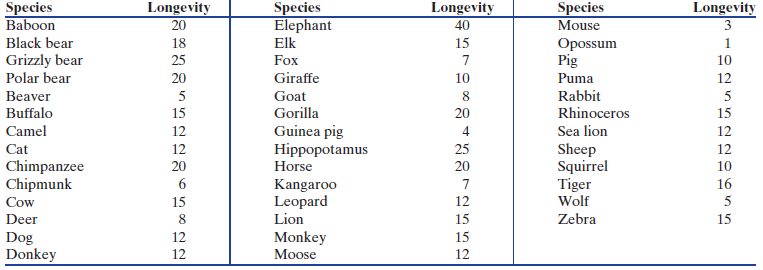
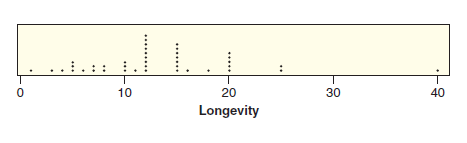
Table 2.14 on page 61 shows longevity (typical lifespan) in years for 40 species of mammals, and the data are also available in MammalLongevity.Table 2.14(a) Use technology to find the mean and standard deviation of the 40 values.(b) The elephant€™s longevity of 40 years appears to be an
The five number summary for daily calorie consumption for the n = 315 participants in the NutritionStudy is (445, 1334, 1667, 2106, 6662).(a) Give the range and the IQR.(b) Which of the following numbers is most likely to be the mean of this dataset? Explain.(c) Which of the following numbers is
Mean 7 and standard deviation 1.Sketch a curve showing a distribution that is symmetric and bell-shaped and has approximately the given mean and standard deviation. In each case, draw the curve on a horizontal axis with scale 0 to 10.
Mean 5 and standard deviation 2.Sketch a curve showing a distribution that is symmetric and bell-shaped and has approximately the given mean and standard deviation. In each case, draw the curve on a horizontal axis with scale 0 to 10.
Mean 5 and standard deviation 0.5.Sketch a curve showing a distribution that is symmetric and bell-shaped and has approximately the given mean and standard deviation. In each case, draw the curve on a horizontal axis with scale 0 to 10.
Draw a histogram or a smooth curve illustrating the shape of a distribution with the properties that:(a) The range is 100 and the interquartile range is 10(b) The range is 50 and the interquartile range is 40
According to the 95% rule, the largest value in a sample from a distribution which is approximately symmetric and bell-shaped should be between 2 and 3 standard deviations above the mean, while the smallest value should be between 2 and 3 standard deviations below the mean. Thus the range should be
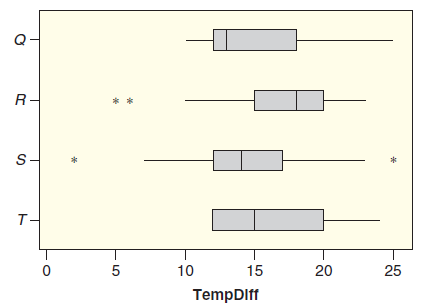
Match each five number summary with one of the boxplots inFigure 2.37.(a) (2, 12, 14, 17, 25)(b) (5, 15, 18, 20, 23)(c) (10, 12, 13, 18, 25)(d) (12, 12, 15, 20, 24)Match the five number summaries with the boxplots. R- S- T- 10 15 25 TempDIff
Show a boxplot for a set of data. In each case:(a) Indicate whether the distribution of the data appears to be skewed to the left, skewed to the right, approximately symmetric, or none of these.(b) Are there any outliers? If so, how many and are they high outliers or low outliers?(c) Give a rough
Show a boxplot for a set of data. In each case:(a) Indicate whether the distribution of the data appears to be skewed to the left, skewed to the right, approximately symmetric, or none of these.(b) Are there any outliers? If so, how many and are they high outliers or low outliers?(c) Give a rough
Show a boxplot for a set of data. In each case:(a) Indicate whether the distribution of the data appears to be skewed to the left, skewed to the right, approximately symmetric, or none of these.(b) Are there any outliers? If so, how many and are they high outliers or low outliers?(c) Give a rough
Show a boxplot for a set of data. In each case:(a) Indicate whether the distribution of the data appears to be skewed to the left, skewed to the right, approximately symmetric, or none of these.(b) Are there any outliers? If so, how many and are they high outliers or low outliers?(c) Give a rough
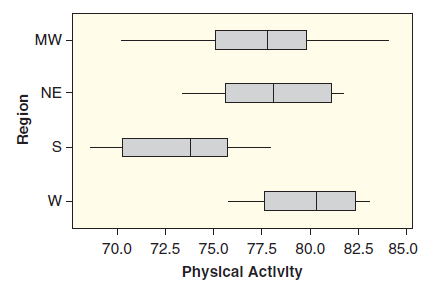
The variables in USStates include the percent of the people in each state who say they have engaged in any physical activity in the last month as well as the region of the country in which the state is found (Midwest, Northeast, South, or West). One of these variables is quantitative and one is
Five number summary: (210, 260, 270, 300, 320); n = 500Tails: 210, 215, 217, 221, 225, . . ., 318, 319, 319, 319, 320, 320Each describe a sample. The information given includes the five number summary, the sample size, and the largest and smallest data values in the tails of the distribution. In
Five number summary: (15, 42, 52, 56, 71); n = 120Tails: 15, 20, 28, 30, 31, . . ., 64, 65, 65, 66, 71Each describe a sample. The information given includes the five number summary, the sample size, and the largest and smallest data values in the tails of the distribution. In each case:(a) Clearly
Five number summary: (42, 72, 78, 80, 99); n = 120Tails: 42, 63, 65, 67, 68, . . ., 88, 89, 95, 96, 99Each describe a sample. The information given includes the five number summary, the sample size, and the largest and smallest data values in the tails of the distribution. In each case:(a) Clearly
Five number summary: (5, 10, 12, 16, 30); n = 40Tails: 5, 5, 6, 6, 6, . . ., 22, 22, 23, 28, 30Each describe a sample. The information given includes the five number summary, the sample size, and the largest and smallest data values in the tails of the distribution. In each case:(a) Clearly
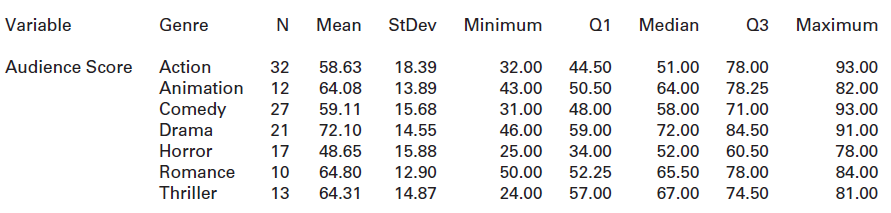
The dataset Hollywood- Movies2011 includes a quantitative variable on the AudienceScore of the movie as well as a categorical variable classifying each movie by its Genre. The computer output below gives the audience rating based on genre. (We have only included the genres with at least 10 movies
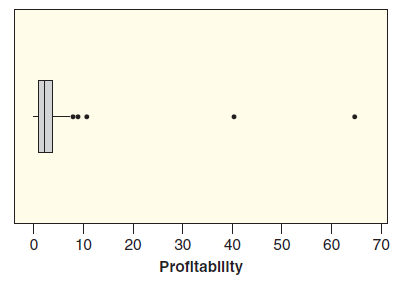
One of the variables in the HollywoodMovies2011 dataset is Profitability, which measures the proportion of the budget recovered in revenue from the movie. A profitability less than 1 means the movie did not make enough money to cover the budget, while a profitability greater than 1 means it made a
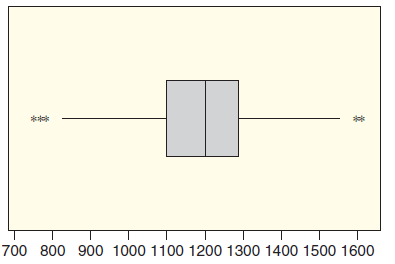
Audience scores (on a scale from 1 to 100) on the Rotten Tomatoes website for all movies that came out of Hollywood in 2011 have a five number summary of (24, 49, 61, 77, 93). (These data are in the variable AudienceScore in the dataset Hollywood-Movies2011.) Are there any outliers in these scores?
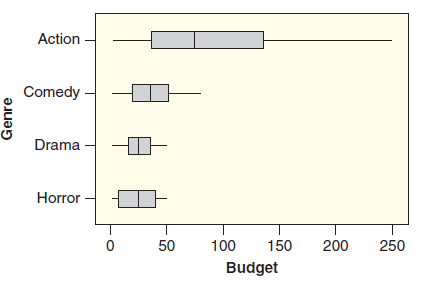
The dataset HollywoodMovies2011 includes a quantitative variable on the Budget of the movie, in millions of dollars, as well as a categorical variable classifying each movie by its Genre. Figure 2.40 shows side-by-side boxplots investigating a relationship between these two variables. (We use four
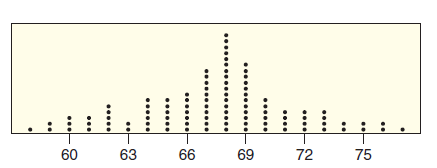
Estimate the five number summary for the data in Figure 2.26.Estimate the summary statistics requested, using the histogram in Figure 2.26. There are n = 100 data points included in the dotplot.Figure 2.26 66 75 63 69 60 72
Estimate values at the 10th percentile and the 90th percentile for the data in Figure 2.26.Estimate the summary statistics requested, using the histogram in Figure 2.26. There are n = 100 data points included in the dotplot.Figure 2.26 66 75 63 69 60 72
Estimate the mean and the standard deviation for the data in the dotplot in Figure 2.26.Estimate the summary statistics requested, using the histogram in Figure 2.26. There are n = 100 data points included in the dotplot.Figure 2.26 66 75 63 69 60 72
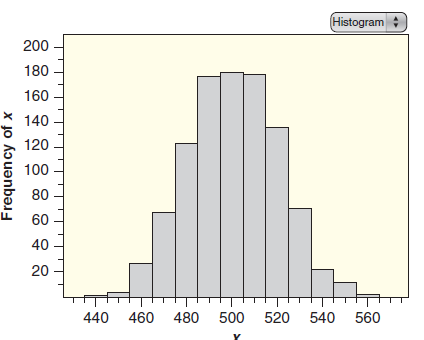
Estimate the five number summary for the data in Figure 2.25.Estimate the summary statistics requested, using the histogram in Figure 2.25. There are n = 100 data points included in the dotplot.Figure 2.25 Histogram 200 180 160 140 120 100 80 60 40 - 20 560 440 460 480 500 520 540 Frequency of x
Estimate values at the 10th percentile and the 90th percentile for the data in Figure 2.25.Estimate the summary statistics requested, using the histogram in Figure 2.25. There are n = 100 data points included in the dotplot.Figure 2.25 Histogram 200 180 160 140 120 100 80 60 40 - 20 560 440 460 480
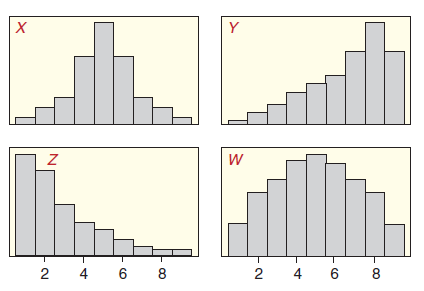
Match each five number summary with one of the histograms in Figure 2.24. The scale is the same on all four histograms.(a) (1, 3, 5, 7, 9)(b) (1, 4, 5, 6, 9)(c) (1, 5, 7, 8, 9)(d) (1, 1, 2, 4, 9)Match each five number summary with the corresponding histogram. 2 2 4 6 8
Match each five number summary with one of the histograms inFigure 2.23.(a) (0, 0.25, 0.5, 0.75, 1)(b) (ˆ’1.08, ˆ’0.30, 0.01, 0.35, 1.27)(c) (0.64, 27.25, 53.16, 100, 275.7)(d) (ˆ’3.5, ˆ’0.63, ˆ’0.11, 0.59, 2.66)(e) (71.45, 92.77, 99.41, 106.60,
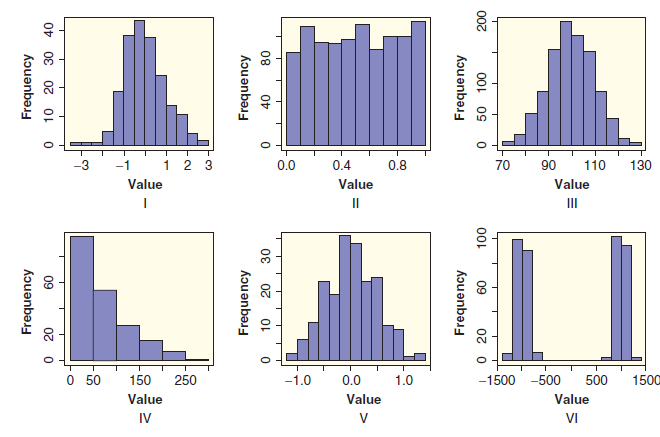
Match each standard deviation with one of the histograms inFigure 2.23.(a) s = 0.5(b) s = 10(c) s = 50(d) s = 1(e) s = 1000(f) s = 0.29The standard deviations with the histograms. -3 -1 2 3 0.0 0.4 0.8 70 90 110 130 Value Value Value II 0 50 150 250 -1.0 0.0 1.0 -1500 -500 500 1500 Value Value
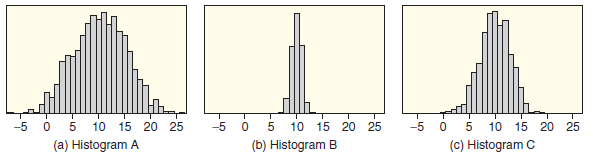
Match the three standard deviations s = 1, s = 3, and s = 5 with the three histograms inFigure 2.22.The standard deviations with the histograms -5 0 5 10 15 20 25 (a) Histogram A 20 25 (b) Histogram B 10 15 -5 10 15 20 25 (c) Histogram C -5
The variable TV, number of hours spent watching television per week, in the StudentSurvey dataset.Use technology to find the following values:(a) The mean and the standard deviation.(b) The five number summary.
The variable Exercise, number of hours spent exercising per week, in the StudentSurvey dataset.Use technology to find the following values:(a) The mean and the standard deviation(b) The five number summary
Table 2.18 shows the number of women (per 1000) between 15 and 44 years of age who have been married grouped by the number of children they have had. Table 2.19 gives the same information for women who have never been married.Table 2.18Number of Children...........................Women per
Calculate the mean and the median for the numbersWhich do you think is a better measure of center for this set of values? Why? (There is no right answer, but think about which you would use.) 1, 1, 1, 1, 1, 1, 2, 5, 7, 12
Describe one quantitative variable that you believe will give data that are skewed to the right, and explain your reasoning. Do not use a variable that has already been discussed.
Give any set of five numbers satisfying the condition that:(a) The mean of the numbers is substantially less than the median.(b) The mean of the numbers is substantially more than the median.(c) The mean and the median are equal.
Apparently, sexual frustration increases the desire for alcohol, at least in fruit flies. Scientists randomly put 24 fruit flies into one of two situations. The 12 fruit flies in the ‘‘mating” group were allowed to mate freely with many available females eager to mate. The 12 in the
In Exercise 2.24 on page 57, we saw that those with a college degree were much more likely to be employed. The same article also gives statistics on earnings in the US in 2009 by education level. The median weekly earnings for high school graduates with no college degree was $626, while the median
Often we are interested not just in a single mean but in a difference in means between two groups. In the Student Survey data, there are 36 seniors: 26 males and 10 females. Table 2.17 gives the number of hours per week that each said he or she spent exercising.Table 2.17(a) Calculate
A survey conducted in May 2010 asked 1917 cell phone users to estimate, on average, the number of text messages sent and received per day.(a) Do you expect the distribution of number of text messages per day to be symmetric, skewed to the right, or skewed to the left?(b) Two measures of center for
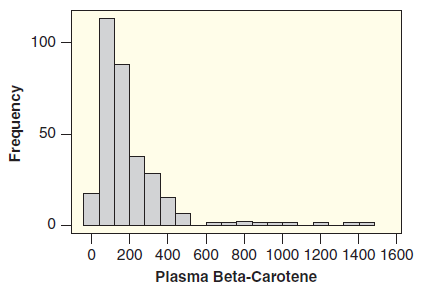
The plasma beta-carotene level (concentration of beta-carotene in the blood), in ng/ml, was measured for a sample of n = 315 individuals, and the results are shown in the histogram inFigure 2.15.(a) Describe the shape of this distribution. Is it symmetric or skewed? Are there any obvious
The number of grams of fiber eaten in one day for a sample of ten people are(a) Find the mean and the median for these data.(b) The value of 115 appears to be an obvious outlier. Compute the mean and the median for the nine numbers with the outlier excluded.(c) Comment on the effect of the outlier
Life expectancy for all the different countries in the world ranges from a low of only 43.9 years (in Afghanistan) to a high of 82.8 years (in San Marino). Life expectancies are clustered at the high end, with about half of all the countries having a life expectancy between about 72 and the maximum
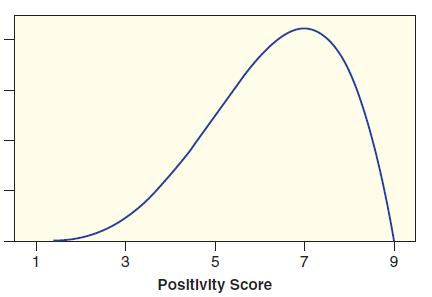
€˜€˜Are natural languages neutrally, positively, or negatively biased?€ That is the question a recent study set out to answer. They found the top 5000 words used in English in each of four different places: Twitter, books on the Google Book Project, The New York
Consider a dataset giving the adult weight of species of insects. Most species of insects weigh less than 5 grams, but there are a few species that weigh a great deal, including the largest insect known: the rare and endangered Giant Weta from New Zealand, which can weigh as much as 71 grams.
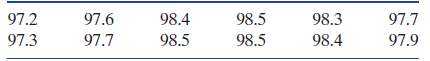
It is commonly believed that normal human body temperature is 98.6—¦F (or 37—¦C). In fact, €˜€˜normal€ temperature can vary from person to person, and for a given person it can vary over the course of a day. Table 2.16 gives a set of
Arsenic is toxic to humans, and people can be exposed to it through contaminated drinking water, food, dust, and soil. Scientists have devised an interesting new way to measure a person€™s level of arsenic poisoning: by examining toenail clippings. In a recent study, scientists measured
The average number of television sets owned per household for all households in the US is 2.6.The correct notation for the mean.
The average number of yards per punt for all punts in the National Football League is 41.5 yards.The correct notation for the mean.
The average number of text messages sent or received in a day was 60, in a survey of n = 799 teen cell phone users conducted in June 2011The correct notation for the mean.
The average number of calories eaten in one day is 2386 calories for a sample of 100 participants.The correct notation for the mean.
Clearly skewed to the right.Draw any dotplot to show a dataset.
Approximately symmetric but not bell-shaped.Draw any dotplot to show a dataset.
Approximately symmetric and bell-shaped.Draw any dotplot to show a dataset.
Clearly skewed to the left.Draw any dotplot to show a dataset.
Does alcohol increase reaction time? Design a randomized experiment to address this question using the method described in each case. Assume the participants are 40 college seniors and the response variable is time to react to an image on a screen after drinking either alcohol or water. Be sure to
The US Department of Transportation announces that of the 250 million registered passenger vehicles in the US, 2.1% are electro-gas hybrids.State whether the data are best described as a population or a sample.
A subscription-based music website tracks its total number of active users.State whether the data are best described as a population or a sample.
Send an email to a random sample of students at a university asking them to reply to the question: ‘‘Do you think this university should fund an ultimate frisbee team?” A small number of students reply. Use the replies to estimate the proportion of all students at the university who support
In Data 1.4 on page 24, we describe the results of a question asked by a national newspaper columnist: ‘‘If you had it to do over again, would you have children?” In addition to those results and a followup national survey, the Kansas City Star selected a random sample of parents from Kansas
‘‘Do metal tags on penguins harm them?”We describe data collection methods. Indicate whether the data come from an experiment or an observational study.
About 60% of a child’s growth hormone is secreted during sleep, so it is believed that a lack of sleep in children might stunt growth.(a) What is the explanatory variable and what is the response variable in this association?(b) Describe a randomized comparative experiment to test this
It is commonly accepted that athletes should ‘‘carbo load,” that is, eat lots of carbohydrates, the day before an event requiring physical endurance. Is there any truth to this? Suppose you want to design an experiment to find out for yourself: ‘‘Does carbo loading actually improve
Causation does not necessarily mean that there is no confounding variable. Give an example of an association between two variables that have a causal relationship AND have a confounding variable.
The survey students consisted of 169 females and 193 males. Find p̂ , the proportion who are female.Find the sample proportion p̂.
The survey included 43 students who smoke and 319 who don’t. Find p̂, the proportion who smoke.Find the sample proportion p̂.
Of the students who identified their class year in the survey, 94 were first years, 195 were sophomores, 35 were juniors, and 36 were seniors. Find p̂, the proportion who are upperclass students (juniors or seniors.)Find the sample proportion p̂.
The math SAT score is higher than the verbal SAT score for 205 of the 355 students who answered the questions about SAT scores. Find p̂, the proportion for whom the math SAT score is higher.Find the sample proportion p̂.
In the 2010 US Census, we see that 37,342,870 people, or 12.4% of all residents, are foreign-born.Give the relevant proportion using correct notation.
A recent headline states that ‘‘73% say Woman President Likely in Next 10 Years.” The report gives the results of a survey of 1000 randomly selected likely voters in the US.Give the relevant proportion using correct notation.
A survey conducted of 1502 randomly selected US adults found that 931 of them believed the government does not provide enough support for soldiers returning from Iraq or Afghanistan.Give the relevant proportion using correct notation.
Of all 1,547,990 members of the high school class of 2010 who took the SAT(Scholastic Aptitude Test), 1,114,273 were from a public high school.Give the relevant proportion using correct notation.
Of the 362 students who answered the question about what award they would prefer, 31 preferred an Academy Award, 149 preferred a Nobel Prize, and 182 preferred an Olympic gold medal.Construct a relative frequency table of the data using the categories given. Give the relative frequencies rounded to
Of the 361 students who answered the question about the number of piercings they had in their body, 188 had no piercings, 82 had one or two piercings, and the rest had more than two.Construct a relative frequency table of the data using the categories given. Give the relative frequencies rounded to
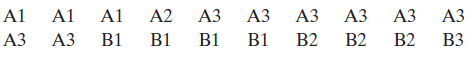
Twenty cases:Cases are classified according to one variable, with categories A and B, and also classified according to a second variable with categories 1, 2, and 3. The cases are shown, with the first digit indicating the value of the first variable and the second digit indicating the value of the
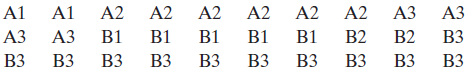
Thirty cases:Cases are classified according to one variable, with categories A and B, and also classified according to a second variable with categories 1, 2, and 3. The cases are shown, with the first digit indicating the value of the first variable and the second digit indicating the value of the
Rock-Paper-Scissors, also called Roshambo, is a popular two-player game often used to quickly determine a winner and loser. In the game, each player puts out a fist (rock), a flat hand (paper), or a hand with two fingers extended (scissors). In the game, rock beats scissors which beats paper which
Showing 1400 - 1500
of 2108
First
8
9
10
11
12
13
14
15
16
17
18
19
20
21
22
Step by Step Answers