New Semester
Started
Get
50% OFF
Study Help!
--h --m --s
Claim Now
Question Answers
Textbooks
Find textbooks, questions and answers
Oops, something went wrong!
Change your search query and then try again
S
Books
FREE
Study Help
Expert Questions
Accounting
General Management
Mathematics
Finance
Organizational Behaviour
Law
Physics
Operating System
Management Leadership
Sociology
Programming
Marketing
Database
Computer Network
Economics
Textbooks Solutions
Accounting
Managerial Accounting
Management Leadership
Cost Accounting
Statistics
Business Law
Corporate Finance
Finance
Economics
Auditing
Tutors
Online Tutors
Find a Tutor
Hire a Tutor
Become a Tutor
AI Tutor
AI Study Planner
NEW
Sell Books
Search
Search
Sign In
Register
study help
mathematics
statistics the art and science
Statistics Unlocking The Power Of Data 1st Edition Robin H. Lock, Patti Frazer Lock, Kari Lock Morgan, Eric F. Lock, Dennis F. Lock - Solutions
In Exercise 5.29, we see that the distribution of sample proportions of US adults with a college degree for random samples of size n = 500 is N(0.275, 0.02). How often will such samples have a proportion, p̂, that is more than 0.30?Exercise 5.29According to the US Census Bureau,4 about 27.5% of US
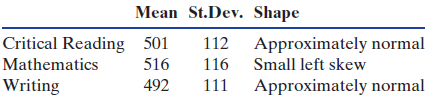
The Scholastic Aptitude Test (SAT) was taken by 1,547,990 college-bound students in the class of 2010. The test has three parts: Critical Reading, Mathematics, and Writing. Scores on all three parts range from 200 to 800. The means, standard deviations, and shapes for the three tests are shown in
According to the US Census Bureau,4 about 27.5% of US adults over the age of 25 have a bachelor’s level (or higher) college degree. For random samples of n = 500 US adults over the age of 25, the sample proportions, p̂, with at least a bachelor’s degree follow a normal distribution with mean
The middle 80% for a standard normal distribution converted to a N(100, 15) distributionAsk you to convert an area from one normal distribution to an equivalent area for a different normal distribution. Draw sketches of both normal distributions, find and label the endpoints, and shade the regions
The area between 1 and 2 for a standard normal distribution converted to a N(100, 15) distributionAsk you to convert an area from one normal distribution to an equivalent area for a different normal distribution. Draw sketches of both normal distributions, find and label the endpoints, and shade
The area above 2.1 for a standard normal distribution converted to a N(500, 80) distributionAsk you to convert an area from one normal distribution to an equivalent area for a different normal distribution. Draw sketches of both normal distributions, find and label the endpoints, and shade the
The lower 10% for a standard normal distribution converted to a N(500, 80) distributionAsk you to convert an area from one normal distribution to an equivalent area for a different normal distribution. Draw sketches of both normal distributions, find and label the endpoints, and shade the regions
The area above 13.4 for a N(10, 2) distribution converted to a standard normal distributionAsk you to convert an area from one normal distribution to an equivalent area for a different normal distribution. Draw sketches of both normal distributions, find and label the endpoints, and shade the
The upper 5% for a N(10, 2) distribution converted to a standard normal distributionAsk you to convert an area from one normal distribution to an equivalent area for a different normal distribution. Draw sketches of both normal distributions, find and label the endpoints, and shade the regions on
The upper 30% for a N(48, 5) distribution converted to a standard normal distributionAsk you to convert an area from one normal distribution to an equivalent area for a different normal distribution. Draw sketches of both normal distributions, find and label the endpoints, and shade the regions on
The area below 40 for a N(48, 5) distribution converted to a standard normal distributionAsk you to convert an area from one normal distribution to an equivalent area for a different normal distribution. Draw sketches of both normal distributions, find and label the endpoints, and shade the regions
(a) The area to the left of the endpoint on a N(5, 2) curve is about 0.10.(b) The area to the right of the endpoint on a N(500, 25) curve is about 0.05.Find endpoint(s) on the given normal density curve with the given property.
(a) The area to the left of the endpoint on a N(100, 15) curve is about 0.75.(b) The area to the right of the endpoint on a N(8, 1) curve is about 0.03.Find endpoint(s) on the given normal density curve with the given property.
(a) The area to the right of the endpoint on a N(25, 8) curve is about 0.25.(b) The area to the left of the endpoint on a N(500, 80) curve is about 0.02.(c) The symmetric middle area on a N(10, 3) curve is about 0.95.Find endpoint(s) on the given normal density curve with the given property.
(a) The area to the right of the endpoint on a N(50, 4) curve is about 0.01.(b) The area to the left of the endpoint on a N(2, 0.05) curve is about 0.70.(c) The symmetric middle area on a N(100, 20) curve is about 0.95.Find endpoint(s) on the given normal density curve with the given property.
(a) The area below 0.21 on a N(0.3, 0.04) distribution(b) The area above 472 on a N(500, 25) distribution(c) The area between 8 and 10 on a N(15, 6) distributionFind the specified areas for a normal density.
(a) The area above 200 on a N(120, 40) distribution(b) The area below 49.5 on a N(50, 0.2) distribution(c) The area between 0.8 and 1.5 on a N(1, 0.3) distributionFind the specified areas for a normal density.
(a) The area above z = −2.10(b) The area below z = −0.5(c) The area between z = −1.5 and z = 0.5Find the specified areas for a N(0, 1) density.
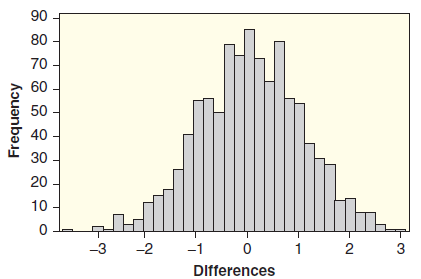
Refer to Figure 4.16, which shows a randomization distribution for hypotheses H0: μ1= μ2vs Ha: μ1‰ μ2. The statistic used for each sample is D = xÌ…1ˆ’ xÌ…2. Answer parts (a) and (b) using the two
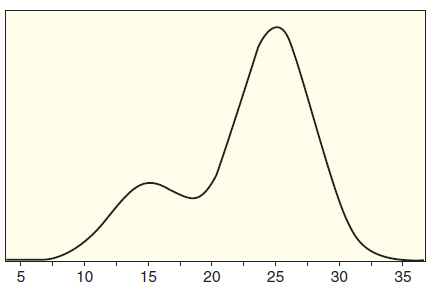
The percentage of the population that is less than 25 is closest to:10% 28% 50% 62% 95%Refer to the density function shown in Figure 5.11. In each exercise, use the density function to choose the best estimate for the proportion of the population found in the specified region.Figure 5.11 10 15 20
The percentage of the population that is more than 30 is closest to:4% 27% 50% 73% 95%Refer to the density function shown in Figure 5.11. In each exercise, use the density function to choose the best estimate for the proportion of the population found in the specified region.Figure 5.11 10 15 20 25
The percentage of the population that is between 10 and 30 is closest to:3% 33% 50% 67% 95%Refer to the density function shown in Figure 5.11. In each exercise, use the density function to choose the best estimate for the proportion of the population found in the specified region.Figure 5.11 10 15
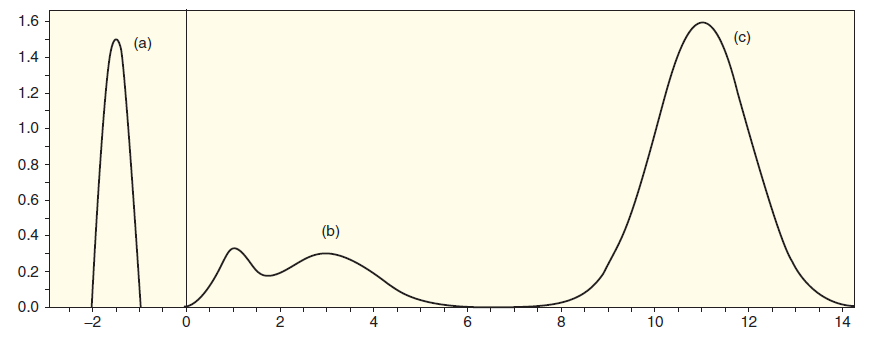
Two of the curves shown in Figure 5.12 are valid density curves and one is not. Identify the one that is not a density. Give a reason for your choice.Figure 5.12 1.6 (c) (a) 1.4 1.2 1.0 0.8 0.6 (b) 0.4 0.2 0.0 12 6 10 14 -2 CO
(a) The area below z = 1.04(b) The area above z = −1.5(c) The area between z = 1 and z = 2Find the specified areas for a N(0, 1) density.
(a) The area below z = 0.8(b) The area above z = 1.2(c) The area between z = −1.75 and z = −1.25Find the specified areas for a N(0, 1) density.
(a) The area above z = 1.35.(b) The area below z = −0.8.(c) The area between z = −1.23 and z = 0.75.Find the specified areas for a N(0, 1) density.
(a) The area to the left of the endpoint is about 0.10.(b) The area to the right of the endpoint is about 0.80.(c) The area between ±z is about 0.95.Find endpoint(s) on a N(0, 1) density with the given property.
(a) The area to the left of the endpoint is about 0.70.(b) The area to the right of the endpoint is about 0.01.(c) The area between ±z is about 0.90.Find endpoint(s) on a N(0, 1) density with the given property.
(a) The area to the right of the endpoint is about 0.90.(b) The area to the left of the endpoint is about 0.65.Find endpoint(s) on a N(0, 1) density with the given property.
(a) The area below 80 on a N(75, 10) distribution(b) The area above 25 on a N(20, 6) distribution(c) The area between 11 and 14 on a N(12.2, 1.6) distributionFind the specified areas for a normal density.
(a) The area to the right of the endpoint is about 0.02.(b) The area to the left of the endpoint is about 0.40.Find endpoint(s) on a N(0, 1) density with the given property.
(a) The area above 6 on a N(5, 1.5) distribution(b) The area below 15 on a N(20, 3) distribution(c) The area between 90 and 100 on a N(100, 6) distributionFind the specified areas for a normal density.
Match the scatterplots in Figure 2.55 with the correlation values.Figure 2.55r = 0.89 Scatter Plot Scatter Plot 4 Scatter Plot + Scatter Plot -1 -1 -1 -1 -2 -2 -2 -2 -2 -1 -2 -1 -2 -1 -1 -2 х (a) (b) (c) (d)
Match the scatterplots in Figure 2.55 with the correlation values.Figure 2.55r = ˆ’0.38 Scatter Plot Scatter Plot 4 Scatter Plot + Scatter Plot -1 -1 -1 -1 -2 -2 -2 -2 -2 -1 -2 -1 -2 -1 -1 -2 х (a) (b) (c) (d)
Match the scatterplots in Figure 2.55 with the correlation values.Figure 2.55r = 0.09 Scatter Plot Scatter Plot 4 Scatter Plot + Scatter Plot -1 -1 -1 -1 -2 -2 -2 -2 -2 -1 -2 -1 -2 -1 -1 -2 х (a) (b) (c) (d)
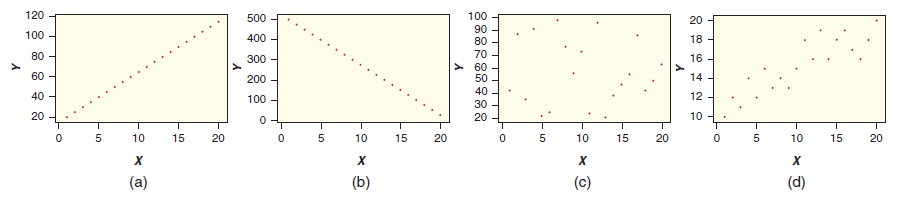
Match the scatterplots in Figure 2.54 with the correlation values.r = 0.8 120 100 90 80 500 20 100 - 400 - 18 80 - 300 - 16 > 60 60 - 40 - 20 - 14 - 200 100 40 30 20 12 10 10 15 20 10 20 15 20 10 20 15 10 15 (d) (a) (b) (c) 원은 is -은 ×으
Match the scatterplots in Figure 2.54 with the correlation values.r = 0 120 100 90 80 500 20 100 - 400 - 18 80 - 300 - 16 > 60 60 - 40 - 20 - 14 - 200 100 40 30 20 12 10 10 15 20 10 20 15 20 10 20 15 10 15 (d) (a) (b) (c) 원은 is -은 ×으
Match the scatterplots in Figure 2.54 with the correlation values.r = ˆ’1 120 100 90 80 500 20 100 - 400 - 18 80 - 300 - 16 > 60 60 - 40 - 20 - 14 - 200 100 40 30 20 12 10 10 15 20 10 20 15 20 10 20 15 10 15 (d) (a) (b) (c) 원은 is -은 ×으
(a) Find the mean x̅.(b) Find the median m.(c) Indicate whether there appear to be any outliers. If so, what are they?8, 12, 3, 18, 15
(a) Find the mean x̅.(b) Find the median m.(c) Indicate whether there appear to be any outliers. If so, what are they?41, 53, 38, 32, 115, 47, 50
(a) Find the mean x̅.(b) Find the median m.(c) Indicate whether there appear to be any outliers. If so, what are they?15, 22, 12, 28, 58, 18, 25, 18
(a) Find the mean x̅.(b) Find the median m.(c) Indicate whether there appear to be any outliers. If so, what are they?110, 112, 118, 119, 122, 125, 129, 135, 138, 140
Use technology to find the following values:10, 11, 13, 14, 14, 17, 18, 20, 21, 25, 28(a) The mean and the standard deviation(b) The five number summary
Use technology to find the following values:1, 3, 4, 5, 7, 10, 18, 20, 25, 31, 42(a) The mean and the standard deviation(b) The five number summary
Use technology to find the following values:(a) The mean and the standard deviation(b) The five number summary4, 5, 8, 4, 11, 8, 18, 12, 5, 15, 22, 7, 14, 11, 12
Testing to see if there is evidence that the correlation between two variables is negative.State the null and alternative hypotheses for the statistical test described.
A reporter on cnn.com stated in July 2010 that 95% of all court cases that go to trial result in a guilty verdict. To test the accuracy of this claim, we collect a random sample of 2000 court cases that went to trial and record the proportion that resulted in a guilty verdict.(a) What is/are the
Refer to Figure 4.16, which shows a randomization distribution for hypotheses H0 : μ1 = μ2 vs Ha : μ1 ‰ μ2. The statistic used for each sample is D = xÌ…1 ˆ’ xÌ…2.
You roll a die 60 times and record the sample proportion of fives, and you want to test whether the die is biased to give more fives than a fair die would ordinarily give. To find the p-value for your sample data, you create a randomization distribution of proportions of fives in many simulated
Refer to Figure 4.16, which shows a randomization distribution for hypotheses H0: μ1= μ2vs Ha: μ1‰ μ2. The statistic used for each sample is D = xÌ…1ˆ’ xÌ…2. Answer parts (a) and (b) using the two
A 95% confidence interval for p: 0.48 to 0.57(a) H0: p = 0.5 vs Ha: p ≠ 0.5(b) H0: p = 0.75 vs Ha: p ≠ 0.75(c) H0: p = 0.4 vs Ha: p ≠ 0.4A confidence interval for a sample is given,
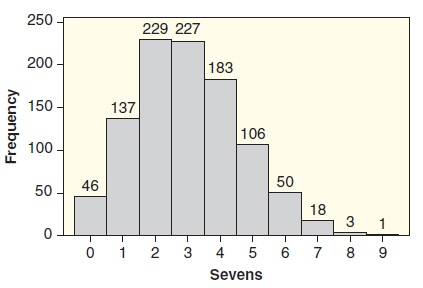
Thirty students are asked to choose a random number between 0 and 9, inclusive, to create a dataset of n = 30 digits. If the numbers are truly random, we would expect about three 0€™s, three 1€™s, three 2€™s, and so on. If the dataset includes eight 7€™s, how
Using the p-value given, are the results significant at a 10% level? At a 5% level? At a 1% level?p-value = 0.0320
Size of a house and Cost to heat the house.Two quantitative variables are described. Do you expect a positive or negative association between the two variables? Explain your choice.
Number of text messages sent on a cell phone and Number of text messages received on the phone.Two quantitative variables are described. Do you expect a positive or negative association between the two variables? Explain your choice.
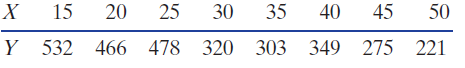
Make a scatterplot of the data. Put the X variable on the horizontal axis and the Y variable on the vertical axis. 15 50 25 30 35 40 45 303 349 275 221 |Y 532 466 478 320
Average household income for all houses in the US, using data from the US Census.State whether the quantity described is a parameter or a statistic and give the correct notation.
Proportion of families in the US who were homeless in 2010. The number of homeless families in 2010 was about 170,000 while the total number of families is given in the 2010 Census at 78 million.Give the correct notation for the quantity described and give its value.
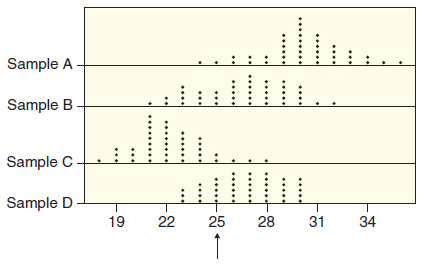
Testing to see if there is evidence that the population mean for mathematics placement exam scores is greater than 25. Use Figure 4.3.Figure 4.3A situation is described for a statistical test and some hypothetical sample results are given. In each case:(a) State which of the possible sample results
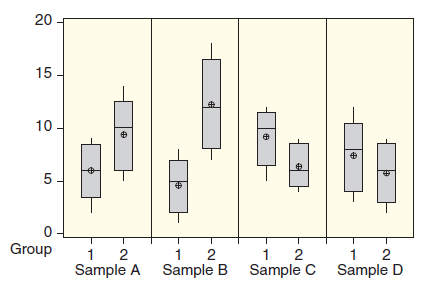
Testing to see if there is evidence that the mean service time at Restaurant #1 is less than the mean service time at Restaurant #2. Use Figure 4.4 and assume that the sample sizes are all the same. Sample means are shown with circles on the boxplots.Figure 4.4A situation is described for a
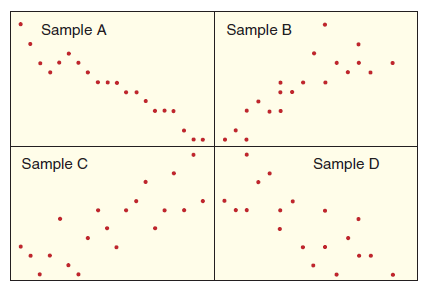
Testing to see if there is evidence that the correlation between exam grades and hours playing video games is negative for a population of students. Use Figure 4.5.Figure 4.5A situation is described for a statistical test and some hypothetical sample results are given. In each case:(a) State which
Testing to see if there is evidence that the proportion of US citizens who can name the capital city of Canada is greater than 0.75. Use the following possible sample results:Sample A: 31 successes out of 40Sample B: 34 successes out of 40Sample C: 27 successes out of 40Sample D: 38 successes out
Testing to see if there is evidence that the mean of group A is not the same as the mean of group B.State the null and alternative hypotheses for the statistical test described.
Testing to see if there is evidence that a proportion is greater than 0.3.State the null and alternative hypotheses for the statistical test described.
Testing to see if there is evidence that a mean is less than 50.State the null and alternative hypotheses for the statistical test described.
Testing to see if there is evidence that the proportion of people who smoke is greater for males than for females.A situation is described for a statistical test. In each case, define the relevant parameter(s) and state the null and alternative hypotheses.
Testing to see if there is evidence that a correlation between height and salary is significant (that is, different than zero).A situation is described for a statistical test. In each case, define the relevant parameter(s) and state the null and alternative hypotheses.
Testing to see if there is evidence that the percentage of a population who watch the Home Shopping Network is less than 20%.A situation is described for a statistical test. In each case, define the relevant parameter(s) and state the null and alternative hypotheses.
Testing to see if average sales are higher in stores where customers are approached by salespeople than in stores where they aren’t.A situation is described for a statistical test. In each case, define the relevant parameter(s) and state the null and alternative hypotheses.
Testing to see if there is evidence that the mean time spent studying per week is different between first-year students and upperclass students.A situation is described for a statistical test. In each case, define the relevant parameter(s) and state the null and alternative hypotheses.
State whether each set of hypotheses is valid for a statistical test. If not valid, explain why not.(a) H0 : μ = 15 vs Ha : μ ≠ 15(b) H0 : p ≠ 0.5 vs Ha : p = 0.5(c) H0 : p1 < p2 vs Ha : p1 > p2(d) H0 : x̅1 = x̅2 vs Ha : x̅1 ≠ x̅2Determine whether the sets of hypotheses
State whether each set of hypotheses is valid for a statistical test. If not valid, explain why not.(a) H0: ρ = 0 vs Ha: ρ < 0(b) H0: p̂ = 0.3 vs Ha: p̂ ≠ 0.3(c) H0: μ1 ≠ μ2 vs Ha: μ1 = μ2(d) H0: p = 25 vs Ha: p ≠ 25Determine whether the sets of hypotheses given are valid
Are children with higher exposure to pesticides more likely to develop ADHD (attention-deficit/hyperactivity disorder)? In a recent study, authors measured levels of urinary dialkyl phosphate (DAP, a common pesticide) concentrations and ascertained ADHD diagnostic status (Yes/No) for 1139 children
Does consuming beer attract mosquitoes? A study done in Burkino Faso, Africa, about the spread of malaria investigated the connection between beer consumption and mosquito attraction. In the experiment, 25 volunteers consumed a liter of beer while 18 volunteers consumed a liter of water. The
It is well established that exercise is beneficial for our bodies. Recent studies appear to indicate that exercise can also do wonders for our brains, or, at least, the brains of mice. In a randomized experiment, one group of mice was given access to a running wheel while a second group of mice was
A taste test is conducted between two brands of diet cola, Brand A and Brand B, to determine if there is evidence that more people prefer Brand A. A total of 100 people participate in the taste test.(a) Define the relevant parameter(s) and state the null and alternative hypotheses.(b) Give an
Is there evidence that mean heart rate is higher in male ICU patients than in female ICU patients?This dataset, stored in ICU Admissions, contains information about a sample of patients admitted to a hospital Intensive Care Unit (ICU). For each of the research questions below, define any relevant
Is there a difference in the proportion who receive CPR based on whether the patient’s race is white or black?This dataset, stored in ICUAdmissions, contains information about a sample of patients admitted to a hospital Intensive Care Unit (ICU). For each of the research questions below, define
Is there a positive linear association between systolic blood pressure and heart rate?This dataset, stored in ICUAdmissions, contains information about a sample of patients admitted to a hospital Intensive Care Unit (ICU). For each of the research questions below, define any relevant parameters and
Is either gender over-represented in patients to the ICU or is the gender breakdown about equal?This dataset, stored in ICUAdmissions, contains information about a sample of patients admitted to a hospital Intensive Care Unit (ICU). For each of the research questions below, define any relevant
Is the average age of ICU patients at this hospital greater than 50?This dataset, stored in ICUAdmissions, contains information about a sample of patients admitted to a hospital Intensive Care Unit (ICU). For each of the research questions below, define any relevant parameters and state the
For a random sample of households in the US, we record annual household income, whether the location is east or west of the Mississippi River, and number of children. We are interested in determining whether there is a difference in average household income between those east of the Mississippi and
Exercise 4.26 discusses a sample of households in the US. We are interested in determining whether or not there is a linear relationship between household income and number of children.(a) Define the relevant parameter(s) and state the null and alternative hypotheses.(b) Which sample correlation
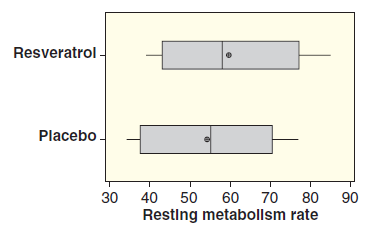
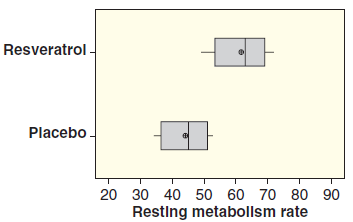
Resveratrol, a compound in grapes and red wine, has been shown to promote weight loss in rodents and now in a primate. Lemurs fed a resveratrol supplement for four weeks had decreased food intake, increased metabolic rate, and a reduction in seasonal body mass gain compared to a control group.
Studies have shown that omega-3 fatty acids have a wide variety of health benefits. Omega-3 oils can be found in foods such as fish, walnuts, and flaxseed. A company selling milled flaxseed advertises that one tablespoon of the product contains, on average, at least 3800mg of ALNA, the primary
Polling 1000 people in a large community to determine the average number of hours a day people watch television.Indicate whether the analysis involves a statistical test. If it does involve a statistical test, state the population parameter(s) of interest and the null and alternative hypotheses.
Polling 1000 people in a large community to determine if there is evidence for the claim that the percentage of people in the community living in a mobile home is greater than 10%.Indicate whether the analysis involves a statistical test. If it does involve a statistical test, state the population
Utilizing the census of a community, which includes information about all residents of the community, to determine if there is evidence for the claim that the percentage of people in the community living in a mobile home is greater than 10%.Indicate whether the analysis involves a statistical test.
Testing 100 right-handed participants on the reaction time of their left and right hands to determine if there is evidence for the claim that the right hand reacts faster than the left.Indicate whether the analysis involves a statistical test. If it does involve a statistical test, state the
Testing 50 people in a driving simulator to find the average reaction time to hit the brakes when an object is seen in the view ahead.Indicate whether the analysis involves a statistical test. If it does involve a statistical test, state the population parameter(s) of interest and the null and
Giving a Coke/Pepsi taste test to random people in New York City to determine if there is evidence for the claim that Pepsi is preferred.Indicate whether the analysis involves a statistical test. If it does involve a statistical test, state the population parameter(s) of interest and the null and
Using the complete voting records of a county to see if there is evidence that more than 50% of the eligible voters in the county voted in the last election.Indicate whether the analysis involves a statistical test. If it does involve a statistical test, state the population parameter(s) of
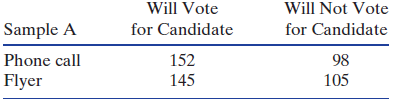
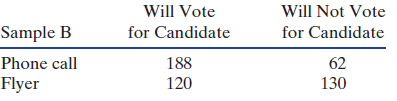
When getting voters to support a candidate in an election, is there a difference between a recorded phone call from the candidate or a flyer about the candidate sent through the mail? A sample of 500 voters is randomly divided into two groups of 250 each, with one group getting the phone call and
Suppose, as in Exercise 4.37, that we wish to compare methods of influencing voters to support a particular candidate, but in this case we are specifically interested in testing whether a phone call is more effective than a flyer. Suppose also that our random sample consists of only 200 voters,
Two p-values are given. Which one provides the strongest evidence against H0?p-value = 0.04 or p-value = 0.62
Can you tell if a mouse is in pain by looking at its facial expression? A new study believes you can. The study created a ‘‘mouse grimace scale” and tested to see if there was a positive correlation between scores on that scale and the degree and duration of pain (based on injections of a
One of the authors and some statistician friends have an ongoing series of Euchre games that will stop when one of the two teams is deemed to be statistically significantly better than the other team. Euchre is a card game and each game results in a win for one team and a loss for the other. Only
Two p-values are given. Which one provides the strongest evidence against H0?p-value = 0.90 or p-value = 0.08
Two p-values are given. Which one provides the strongest evidence against H0?p-value = 0.007 or p-value = 0.13
Two p-values are given. Which one provides the strongest evidence against H0?p-value = 0.02 or p-value = 0.0008
Showing 1000 - 1100
of 2108
First
4
5
6
7
8
9
10
11
12
13
14
15
16
17
18
Last
Step by Step Answers