New Semester
Started
Get
50% OFF
Study Help!
--h --m --s
Claim Now
Question Answers
Textbooks
Find textbooks, questions and answers
Oops, something went wrong!
Change your search query and then try again
S
Books
FREE
Study Help
Expert Questions
Accounting
General Management
Mathematics
Finance
Organizational Behaviour
Law
Physics
Operating System
Management Leadership
Sociology
Programming
Marketing
Database
Computer Network
Economics
Textbooks Solutions
Accounting
Managerial Accounting
Management Leadership
Cost Accounting
Statistics
Business Law
Corporate Finance
Finance
Economics
Auditing
Tutors
Online Tutors
Find a Tutor
Hire a Tutor
Become a Tutor
AI Tutor
AI Study Planner
NEW
Sell Books
Search
Search
Sign In
Register
study help
business
business research methods
Business Research Methods 11th Edition Donald Cooper, Pamela Schindler - Solutions
5 What type of multivariate method do you recommend in each of the following cases and why?a You want to develop an estimating equation that will be used to predict which applicants will come to your university as students.b You would like to predict family income using such variables as education
4 Describe how you would create a conjoint analysis study of off-road vehicles. Restrict your brands to three, and suggest possible factors and levels. The full-concept description should not exceed 256 decision options.
3 How could discriminant analysis be used to provide insight into MANOVA results where the MANOVA has one independent variable (a factor with two levels)?
2 Describe the differences between dependency techniques and interdependency techniques. When would you choose a dependency technique?
1 Distinguish among multidimensional scaling, cluster analysis, and factor analysis.
9 How perceptions of products or services are revealed numerically and geometrically by multidimensional scaling
8 How cluster analysis techniques identify homogenous groups of objects or people using a set of variables to compare their attributes and/or characteristics.
7 How principal components analysis extracts uncorrelated factors from an initial set of variables and how (exploratory)factor analysis reduces the number of variables to discover underlying constructs.
6 How conjoint analysis assists researchers to discover the most important attributes and levels of desirable features.
5 How structural equation modeling explains causality among constructs that cannot be directly measured.
4 How multivariate analysis of variance assesses the relationship between two or more metric dependent variables and independent classifi catory variables.
3 How discriminant analysis classifi es people or objects into categorical groups using several metric predictors.
2 How multiple regression predicts a metric dependent variable from a set of metric independent variables.
1 How to classify and select multivariate techniques.
13 The head of New York City’s teachers’ union has a theory that every time there is something that could be construed as bad news for the city’s Department of Education, the city leaks a salacious story about teacher misconduct to draw attention away from the real bad news.• December 8,
12 For the following data,a Calculate the correlation between X and Y .b Interpret the sign of the correlation.c Interpret the square of the correlation.d Plot the least-squares line.e Test for a linear relationship: X Y 25 19 59 7 17 12 14 23 12 20 9 25 8 13 26 28 20
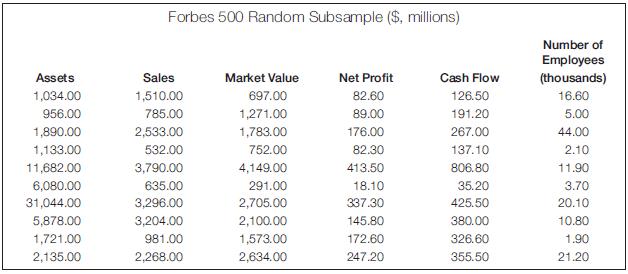
11 Using the preceding matrix data (Forbes 500), select a pair of variables and run a simple regression. Then investigate the appropriateness of the model for the data using diagnostic tools for evaluating assumptions.
10 Secure Spearman rank-order correlations for the largest Pearson coeffi cient in the matrix from question 9. Explain the differences between the two fi ndings.
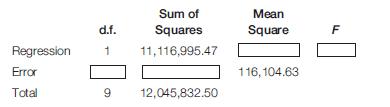
9 Fill in the missing blocks for the ANOVA summary table on net profi ts and market value used with regression analysis.ANOVA Summary Tablea What does the F tell you? (alpha 5 .05)b What is the t value? Explain its meaning. Sum of d.f. Regression 1 Squares 11,116,995.47 Mean Square F Error
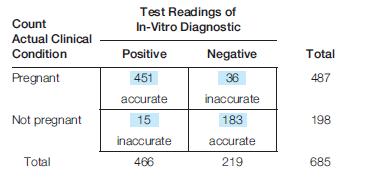
8 A home pregnancy test claims to be 97 percent accurate when consumers obtain a positive result. To what extent are the variables of “actual clinical condition” and “test readings” related?a Compute phi, Cramer’s V , and the contingency coeffi -cient for the following table. What can you
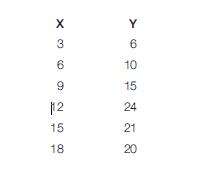
7 Using the following data,a Create a scatterplot.b Find the least-squares line.c Plot the line on the diagram.d Predict: Y if X is 10.Y if X is 17. X Y 3 6 6 10 9 15 12 24 15 21 18 20
6 What would the numbers of “police calls resulting in arrest”for Gladeside and Oceanside need to change to in order to support the conclusion of “disparate impact.”
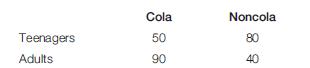
5 A research team conducted a study of soft-drink preferences among residents in a test market prior to an advertising campaign for a new cola product. Of the participants, 130 are teenagers and 130 are adults. The researchers secured the following results:Calculate an appropriate measure of
4 Using the table data in question 3, compute Somers’s d symmetric and then use opinion as the dependent variable.Decide which approach is best for reporting the decision.
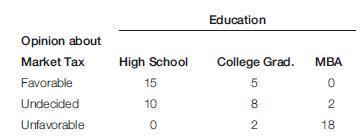
3 A polling organization collected data on a sample of 60 registered voters regarding a tax on the market value of equity transactions as one remedy for the budget defi cit.a Compute gamma for the table.b Compute tau b or tau c for the same data.c What accounts for the differences?d Decide which is
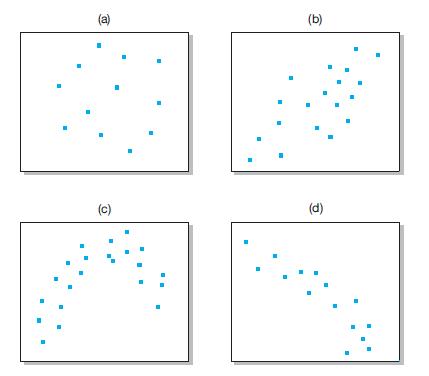
2 Describe the relationship between the two variables in the four plots. (a) (b) (c) (d)
1 Distinguish between the following:a Regression coeffi cient and correlation coeffi cient.b r 5 0 and r 5 0.c The test of the true slope, the test of the intercept, and r 2 5 0.d r 2 and r .e A slope of 0.f F and t 2 .
If you were Gap and about to design a store to open in London, how would you design a study to verify Paco Underhill’s conclusions about left-hand dominance?
The nonparametric measures of association and the alternatives they offer when key assumptions and requirements for parametric techniques cannot be met.
How to test regression models for linearity and whether the equation is effective in fi tting the data.
How predictions are made with regression analysis using the method of least squares to minimize errors in drawing a line of best fi t.
Discuss The uses, requirements, and interpretation of the product moment correlation coeffi cient.
How correlation analysis may be applied to study relationships between two or more variables.
14 Researchers at the University of Aberdeen found that when people were asked to recall past events or imagine future ones, the participants’ bodies subliminally acted out the metaphors we commonly conceptualized with the fl ow of time. With past years, the participants leaned backward, while
13 A computer manufacturer is introducing a new product specifi cally targeted at the home market and wishes to compare the effectiveness of three sales strategies: computer stores, home electronics stores, and department stores. Numbers of sales by 15 salespeople are recorded here:a Test the
12 One-Koat Paint Company has developed a new type of porch paint that it hopes will be the most durable on the market. The R&D group tests the new product against the two leading competing products by using a machine that scrubs until it wears through the coating. One-Koat runs fi ve trials
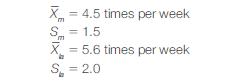
11 You do a survey of marketing students and liberal arts school students to fi nd out how many times a week they read a daily newspaper. In each case, you interview 100 students. You fi nd the following:Test the hypothesis that there is no signifi cant difference between these two samples. Xm 4.5
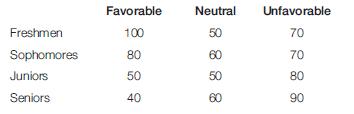
10 A random sample of students is interviewed to determine if there is an association between class and attitude toward corporations. With the following results, test the hypothesis that there is no difference among students on this attitude. Favorable Neutral Unfavorable Freshmen 100 50 Sophomores
9 You contact a random sample of 36 graduates of Western University and learn that their starting salaries averaged$28,000 last year. You then contact a random sample of 40 graduates from Eastern University and fi nd that their average starting salary was $28,800. In each case, the standard
8 You are curious about whether the professors and students at your school are of different political persuasions, so you take a sample of 20 professors and 20 students drawn randomly from each population. You fi nd that 10 professors say they are conservative and 6 students say they are
7 You conduct a survey of a sample of 25 members of this year’s graduating marketing students and fi nd that the average GPA is 3.2. The standard deviation of the sample is 0.4. Over the last 10 years, the average GPA has been 3.0. Is the GPA of this year’s students signifi cantly different
6 What hypothesis testing procedure would you use in the following situations?a A test classifi es applicants as accepted or rejected. On the basis of data on 200 applicants, we test the hypothesis that ad placement success is not related to gender.b A company manufactures and markets automobiles
5 Suggest situations where the researcher should be more concerned with Type II error than with Type I error.a How can the probability of a Type I error be reduced?A Type II error?b How does practical signifi cance differ from statistical signifi cance?c Suppose you interview all the members of the
4 Describe the assumptions for ANOVA, and explain how they may be diagnosed.
3 In analysis of variance, what is the purpose of the mean square between and the mean square within? If the null hypothesis is accepted, what do these quantities look like?
2 Summarize the steps of hypothesis testing. What is the virtue of this procedure?
1 Distinguish between the following:a Parametric tests and nonparametric tests.b Type I error and Type II error.c Null hypothesis and alternative hypothesis.d Acceptance region and rejection region.e One-tailed tests and two-tailed tests.f Type II error and the power of the test.
discuss 6 How to interpret the various test statistics.
discuss 5 The factors that infl uence the selection of an appropriate test of statistical signifi cance.
discuss 4 The differences between parametric and nonparametric tests and when to use each.
discuss 3 The six-step hypothesis testing procedure.
discuss 2 What a statistically signifi cant difference is.
discuss The nature and logic of hypothesis testing.
8 Asustek, the Taiwanese manufacturer that basically invented the netbook category, has been researching more radical design ideas, including a classy wrist-top computer, the Waveface Ultra. It is made from a bendable display that can connect to the Internet, make phone calls, and crunch
7 Use the data in Exhibit 16-5 to construct a stem-and-leaf display.a Where do you fi nd the main body of the distribution?b How many values reside outside the inner fence(s)?
6 Identify the variables being cross-tabulated by Sammye.Identify some plausible reasons why such an exploration would be a good idea.
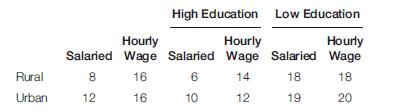
5 Assume you have collected data on sales associates of a large retail organization in a major metropolitan area. You analyze the data by type of work classifi cation, education level, and whether the workers were raised in a rural or urban setting. The results are shown here. How would you
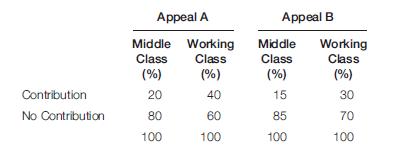
4 A local health agency is experimenting with two appeal letters, A and B, with which to raise funds. It sends out 400 of the A appeal and 400 of the B appeal (each subsample is divided equally among working-class and middle-class neighborhoods). The agency secures the results shown in the
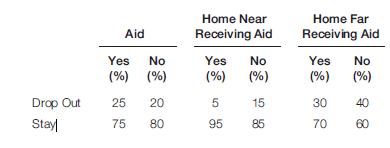
3 You study the attrition of entering college freshmen(those students who enter college as freshmen but don’t stay to graduate). You fi nd the following relationships between attrition, aid, and distance of home from college.What is your interpretation? Consider all variables and relationships.
2 Suppose you were preparing two-way tables of percentages for the following pairs of variables. How would you run the percentages?a Age and consumption of breakfast cereal.b Family income and confi dence about the family’s future.c Marital status and sports participation.d Crime rate and
1 Defi ne or explain:a Marginals.b Pareto diagram.c Nonresistant statistics.d Lower control limit.e The fi ve-number summary.
• Did card activity, which is linked to charitable donations, permit Starbucks to give back to the communities in which it operates in a signifi cant way? BusinessWeek recognized the Starbucks Card Duetto™ Visa as one of the important new products of 2003. In fact, it was the only fi nancial
• Did the card prove valuable to all partners: Starbucks, Chase, and Visa? BusinessWeek recognized the Starbucks Card Duetto™ Visa as one of the important new products of 2003. In fact, it was the only fi nancial product on the list. Starbucks Card Duetto™ Visa is a multifunction card that
• Does the card enhance the Starbucks customer experience (how satisfi ed is each customer, and do customers feel appreciated)? BusinessWeek recognized the Starbucks Card Duetto™ Visa as one of the important new products of 2003. In fact, it was the only fi nancial product on the list.
How cross-tabulation is used to examine relationships involving categorical variables, serves as a framework for later statistical testing, and makes table-based analysis using one or more control variables an effi cient tool for data visualization and decision making.
8 Your responses to the latest U.S. Census were used for two purposes. First, the Census Bureau tallied each response to produce an offi cial population count. Second, it produced a 1-in-20 sub-sample used for analysis by researchers. For those younger than 65, the estimates from the sample are
7 Choose one of the cases from the text website that has an instrument (check the Case Abstracts section for a listing of all cases and an abstract for each). Code the instrument for data entry.
6 Data entry followed data collection in the research profi led during the opening vignette. What concerned Jason about this process?
5 What data preparation process was Jason doing during data entry?
3 A problem facing shoe store managers is that many shoes eventually must be sold at markdown prices. This prompts us to conduct a mail survey of shoe store managers in which we ask, What methods have you found most successful for reducing the problem of high markdowns? We are interested in
2 How should the researcher handle “don’t know” responses?
1 Define or explain:d Precoded instruments.e Content analysis.f Missing data.g Optical mark recognition.
1 Define or explain:a Coding rules.b Spreadsheet data entry.c Bar codes.
What are some of the advantages to having touch-screen data entry?
Discuss The options for data entry and manipulation.
Discuss Problems with and solutions for “don’t know” responses and missing data.
Discuss The use of content analysis to interpret and summarize open questions.
Discuss How coding is used to assign numbers and other symbols to answers and to categorize responses.
Discuss The importance of editing the collected raw data to detect errors and omissions.
10 Using Exhibit 14-8 as your guide, for each sampling technique describe the sample frame for a study of employers’skill needs in new hires using the industry in which you are currently working or wish to work.
9 How would you draw a cluster sample for the CityBus project?
8 Design an alternative nonprobability sample that will be more representative of infrequent and potential riders for the CityBus project.
7 Your large fi rm is about to change to a customer-centered organization structure, in which employees who have rarely had customer contact will now likely signifi cantly infl uence customer satisfaction and retention. As part of the transition, your superior wants an accurate evaluation of the
6 Your task is to interview a representative sample of attendees for the large concert venue where you work. The new season schedule includes 200 live concerts featuring all types of musicians and musical groups. Since neither the number of attendees nor their descriptive characteristics are known
5 Why would a researcher use a quota purposive sample?
5. What size sample is needed?
4. What is the appropriate sampling method?
3. What is the sampling frame?
2. What are the parameters of interest?
1. What is the target population?
Discuss The various sampling techniques and when each is used.
Discuss The two categories of sampling techniques and the variety of sampling techniques within each category.
Discuss The fi ve questions that must be answered to develop a sampling plan.
Discuss The characteristics of accuracy and precision for measuring sample validity.
Discuss The two premises on which sampling theory is based.
15 One of Kraft’s hallmark brands is Jell-O. During May 2009, the Jell-O Sugar Free Pudding cups line was getting a makeover with the introduction of two new fl avors: Boston Cream Pie and Cinnamon Roll.a What survey research would you have done to determine whether to introduce these new fl
14 Using Exhibits 13-1, 13-4, and 13-9, develop the fl owchart for the Albany Outpatient Laser Clinic study in the opening vignette.
13 To evaluate whether presurgery patient attitudes affect recovery and ultimate patient satisfaction with the Albany Outpatient Laser Clinic, design a question for the selfadministered survey. (You may wish to review the opening vignettes in this chapter and Chapter 9.)From Concept to Practice
11 Assume the American Society of Training Directors is studying its membership in order to enhance member benefi ts and attract new members. Below is a copy of a cover letter and mail questionnaire received by a member of the society. Please evaluate the usefulness and tone of the letter and the
10 In a class project, students developed a brief selfadministered questionnaire by which they might quickly evaluate a professor. One student submitted the following instrument. Evaluate the questions asked and the format of the instrument.Professor Evaluation Form 1. Overall, how would you rate
Showing 1200 - 1300
of 1984
First
6
7
8
9
10
11
12
13
14
15
16
17
18
19
20
Step by Step Answers