New Semester
Started
Get
50% OFF
Study Help!
--h --m --s
Claim Now
Question Answers
Textbooks
Find textbooks, questions and answers
Oops, something went wrong!
Change your search query and then try again
S
Books
FREE
Study Help
Expert Questions
Accounting
General Management
Mathematics
Finance
Organizational Behaviour
Law
Physics
Operating System
Management Leadership
Sociology
Programming
Marketing
Database
Computer Network
Economics
Textbooks Solutions
Accounting
Managerial Accounting
Management Leadership
Cost Accounting
Statistics
Business Law
Corporate Finance
Finance
Economics
Auditing
Tutors
Online Tutors
Find a Tutor
Hire a Tutor
Become a Tutor
AI Tutor
AI Study Planner
NEW
Sell Books
Search
Search
Sign In
Register
study help
business
management fundamentals concepts
Essentials Of Statistics For The Behavioral Sciences 3rd Edition Susan A. Nolan - Solutions
You are conducting a z test on a sample of 50 people with an average SAT verbal score of 542 (assume we know the population mean to be 500 and the standard deviation to be 100). Calculate the mean and the spread o f the comparison distribution (μM and σ M).
State the percentage of scores in a one-tailed critical region for each of the following p levels: a. 0.05 b. 0.10 c. 0.01
For each of the following p levels, what percentage of the data will be in each critical region for a two-tailed test? a. 0.05 b. 0.10 c. 0.01
If the critical values for a hypothesis test occur where 2.5% of the distribution is in each tail, what are the cutoffs for z?
Rewrite each of the following probabilities, or p levels, as percentages: a. 0.19 b. 0.04 c. 0.92
Rewrite each of the following percentages as probabilities, or p levels: a. 5% b. 83% c. 51%
Using the z table in Appendix B, calculate the following percentages for a z score of 1.71: a. Above this z score b. Below this z score c. At least as extreme as this z score
Using the z table in Appendix B, calculate the following percentages for a z score of −0.08: a. Above this z score b. Below this z score c. At least as extreme as this z score
Calculate the following percentages for a z score of 0.74, with a tail of 22.96%: a. What percentage of scores falls below this z score? b. What percentage of scores falls between the mean and this z score? c. What proportion of scores falls below a z score of −0.74?
Calculate the following percentages for a z score of −1.61, with a tail of 5.37%: a. What percentage of scores falls above this z score? b. What percentage of scores falls between the mean and this z score? c. What proportion of scores falls above a z score of 1.61?
Write the symbols for the null hypothesis and research hypothesis for a one-tailed test.
Why do researchers typically use a two-tailed test rather than a one-tailed test?
What is the difference between a one-tailed hypothesis test and a two-tailed hypothesis test in terms of critical regions?
Using everyday language rather than statistical language, explain why the word cutoff might have been chosen to define the point beyond which we reject the null hypothesis.
Using everyday language rather than statistical language, explain why the words critical region might have been chosen to define the area in which a z statistic must fall in order for a researcher to reject the null hypothesis.
What do these symbolic expressions mean:H0 : μ1 = μ2 and H1 : μ1 ≠ μ2?
What does statistically significant mean to statisticians?
What is the standard size of the critical region used by most statisticians?
What are critical values and the critical region?
What are the six steps of hypothesis testing?
What sample size is recommended in order to meet the assumption of a normal distribution of means, even when the underlying population of scores is not normal?
In statistics, what do we mean by assumptions?
How is calculating a percentile for a mean from a distribution of means different from doing so for a score from a distribution of scores?
How do we calculate the percentage of scores below a particular positive z score?
When we look up a z score on the z table, what information can we report?
In their book Freakonomics, Levitt and Dubner (2009) describe alleged cheating among teachers in the Chicago public school system. Certain classrooms had suspiciously strong performances on standardized tests that often mysteriously declined the following year when a new teacher taught the same
Earlier, we considered data from the GSS on numbers of close friends people reported having. The mean for this variable is 7.44, with a standard deviation of 10.98. Let’s say that you decide to use the GSS data to test whether people who live in rural areas have a different mean number of friends
The three most common treatments for blocked coronary arteries are medication; bypass surgery; and angioplasty, which is a medical procedure that involves clearing out arteries and that leads to higher profits for doctors than do the other two procedures. The highest rate of angioplasty in the
Credit card companies will often call cardholders if the pattern of use indicates that the card might have been stolen. Let’s say that you charge an average of $280 a month on your credit card, with a standard deviation of $75. The credit card company will call you anytime your purchases for the
Refer to Exercise 6.49. Again, pretend that the GSS sample is the entire population of interest. a. Imagine that you randomly selected 80 people from this population, and that they had a mean of 8.7. Would you compare this sample mean to a distribution of scores or to a distribution of means?
The revised version of the Minnesota Multiphasic Personality Inventory (MMPI-2) is the most frequently administered self-report personality measure. Test-takers respond to more than 500 true/false statements, and their responses are scored, typically by a computer, on a number of scales (e.g.,
Researchers have reported that the projected life expectancy for South African men diagnosed with human immunodeficiency virus (HIV) at age 20 who receive antiretroviral therapy (ART) is 27.6 years ( Johnson et al., 2013). Imagine that the researchers determined this by following 250 people with
Let’s look at baseball and football again. We’ll look at data for all of the teams in Major League Baseball (MLB) and the National Football League (NFL), respectively. a. In 2012, the mean number of wins for MLB teams was 81.00, with a standard deviation of 11.733. The perennial underdogs,
Our statistics students were asked to rate their admiration of Hillary Clinton on a scale of 1 to 7. They also were asked to rate their admiration of actor, singer, and former American Idol judge Jennifer Lopez and their admiration of tennis player Venus Williams on a scale of 1 to 7. As noted
A common quandary faces sports fans who live in the same city but avidly follow different sports. How does one determine whose team did better with respect to its league division? In 2012, the Atlanta Braves baseball team and the Atlanta Falcons football team both did well. The Braves won 94 games
As noted in How It Works 6.1, Georgiou and colleagues (1997) reported that college students had healthier eating habits, on average, than did those who were neither college students nor college graduates. The 412 students in the study ate breakfast a mean of 4.1 times per week, with a standard
Statistics geeks rejoiced when the New York Times published an article on the normal curve (Dunn, 2013)! Biologist Casey Dunn wrote that “Many real-world observations can be approximated by, and tested against, the same expected pattern: the normal distribution.” He described the normal curve
For each of the following variables, state whether the distribution of scores would likely approximate a normal curve. Explain your answer. a. Number of minutes that students check Facebook and other social media each week b. Volume of water that people drink each day c. The length,
The normal curve and real-life variables, part I: For each of the following variables, state whether the distribution of scores would likely approximate a normal curve. Explain your answer.a. Number of movies that a college student watches in a year b. Number of full-page advertisements in a
A study using the Consideration of Future Consequences scale found a mean CFC score of 3.20, with a standard deviation of 0.70, for the 800 students in the sample (Adams, 2012). a. Imagine that your z score on the CFC score is −1.2. What is your raw score? Use symbolic notation and the
We have already discussed summary parameters for CFC scores for the population of participants in a study by Adams (2012). The mean CFC score was 3.20, with a standard deviation of 0.70. (Remember that we treated the sample of 800 participants as the entire population.) Imagine that you randomly
A sample of 148 of our statistics students rated their level of admiration for Hillary Clinton on a scale of 1 to 7. The mean rating was 4.06, and the standard deviation was 1.70. (For this exercise, treat this sample as the entire population of interest.) a. Use these data to demonstrate that
A sample of 150 statistics students reported the typical number of hours that they sleep on a weeknight. The mean number of hours was 6.65, and the standard deviation was 1.24. (For this exercise, treat this sample as the entire population of interest.) a. What is always the mean of the z
Distributions and getting ready for a date: We asked 150 students in our statistics classes how long, in minutes, they typically spend getting ready for a date. The scores ranged from 1 minute to 120 minutes, and the mean was 51.52 minute s. Here are the data for 40 of these students:a. Construct a
By design, the verbal subtest of the GRE has a population mean of 500 and a population standard deviation of 100 (the quantitative subtest has the same mean and standard deviation). a. Use symbolic notation to state the mean and the standard deviation of the GRE verbal test. b. Convert a
For a population with a mean of 250 and a standard deviation of 47, calculate the z scores for 203 and 297. Explain the meaning of these values.
A population has a mean of 1179 and a standard deviation of 164. Calculate z scores for each of the following raw scores:a. 1000 b. 721 c. 1531 d. 1184
Each of the following equations has an error. Identify, fix, and explain the error in each of the following equations. a.b.c.d. Ом VN (u – Hn) (for a distribution of means) Ом ||
Many variables are normally distributed, but not all are. (Fortunately, the central limit theorem saves us when we conduct research on samples from nonnormal populations if the samples are larger than 30!) Which of the following are likely to be normally distributed, and which are likely to be
For a population with a mean of 250 and a standard deviation of 47, calculate the z score for 250. Explain the meaning of the value you obtain.
What does a z statistic—a z score based on a distribution of means—tell us about a sample mean?
Why does the standard error become smaller simply by increasing the sample size?
What is the difference between standard deviation and standard error?
What does the symbol σ M stand for?
What does the symbol μ M stand for?
Why is the central limit theorem such an important idea for dealing with a population that is not normally distributed?
What are the mean and standard deviation of the z distribution?
Give three reasons why z scores are useful.
Explain how the word standardize is used in everyday conversation; then explain how statisticians use it.
How does the size of a sample of scores affect the shape of the distribution of data?
What point on the normal curve represents the most commonly occurring observation?
Explain how the word normal is used in everyday conversation; then explain how statisticians use it.
Researchers conducted a study of 18 patients whose depression had not responded to treatment (Zarate, 2006). Half received one intravenous dose of ketamine, a hypothesized quick fix for depression; half received one intravenous dose of placebo. Far more of the patients who received ketamine
Sixty-four male students were ordered, after they had violated university alcohol rules, to meet with a school counselor. Borsari and Carey (2005) randomly assigned these students to one of two conditions. Those in the first condition were assigned to undergo a newly developed brief motivational
Richards (2006) reported data from a study by the American Prospect on the genders of op-ed writers who addressed the topic of abortion in the New York Times. Over a 2-year period, the American Prospect counted 124 articles that discussed abortion (from a wide range of political and ideological
“Do Immigrants Make Us Safer?” asked the title of a New York Times Magazine article (Press, 2006). The article reported findings from several U.S.-based studies, including several conducted by Harvard sociologist Robert Sampson in Chicago. For each of the following findings, draw the table of
Here are three ways to assess one’s performance in high school: (1) GPA at graduation, (2) Whether one graduated with honors (as indicated by graduating with a GPA of at least 3.5), (3) Class rank at graduation. For example, Abdul had a 3.98 GPA, graduated with honors, and was
A New York Times article on grade inflation reported several findings related to a tendency for average grades to rise over the years and a tendency for the top-ranked institutions to give the highest average grades (Archibold, 1998). For each of the findings outlined below, state (i) The
Weinberg, Fleisher, and Hashimoto (2007) studied almost 50,000 students’ evaluations of their professors in nearly 400 economics courses at the Ohio State University over a 10-year period. For each of their findings, outlined below, state (i) The independent variable or variables, and, where
For each of the following research questions, state whether a parametric or nonparametric hypothesis test is more appropriate. Explain your answers. a. Are women more or less likely than men to be economics majors? b. At a small company with 15 staff and one top boss, do those with a
In 2010, Sandra Bullock won an Academy Award for best actress. Shortly thereafter, she discovered that her husband was cheating on her. Headlines erupted about a supposed Oscar curse that befalls women, and many in the media wondered whether ambitious women— whether actors or corporate
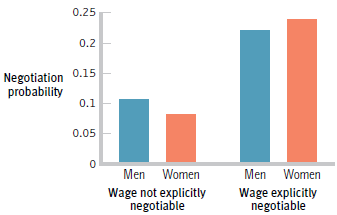
Researchers investigated whether or not language in job postings affected the likelihood that women and men would negotiate regarding salary (Leibbrandt & List, 2012). Some job postings clearly indicated that the salary was negotiable, and others contained no such statement. The postings were
Students at Hunter College studied bicycle safety in New York City (Tuckel & Milczarski, 2014). They reported data on cyclists who were riding their own bikes and were not cycling as part of their job (they were not, for example, riding as delivery workers). They reported that 28.4% of male
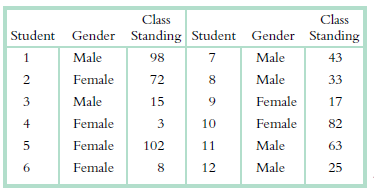
Are men or women more likely to be at the top of their class? The following table depicts fictional class standings for a group of men and women:a. Compute the Mann€“Whitney U test statistic. b. Make a decision regarding the null hypothesis. Is there a significant difference in the
Assume a researcher compared the performance of two independent groups of participants on an ordinal variable using the Mann–Whitney U test. The first group had 8 participants and the second group had 11 participants. a. Using a p level of 0.05 a nd a two-tailed test, determine the critical
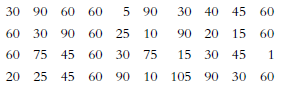
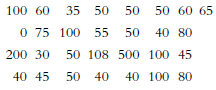
Compute the Mann€“Whitney U statistic for the following data. Each participant has been assigned a group and a participant number; these are shown in the €œGroup 1€ and €œGroup 2€ columns. 100 60 35 50 50 50 60 65 0 75 100 55 50 40 80 200 30 50
Compute the Mann€“Whitney U statistic for the following data. Each participant has been assigned a group and a participant number; these are shown in the €œGroup 1€ and €œGroup 2€ columns. 0.25 0.2 Negotiation 0.15 probability 0.1 0.05 Men Women
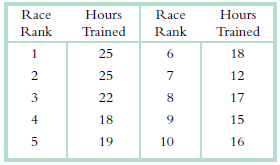
The following fictional data represent the finishing place for runners of a 5-kilometer race and the number of hours they trained per week.a. Calculate the Spearman correlation for this set of data. b. Make a decision regarding the null hypothesis. Is there a significant correlation between a
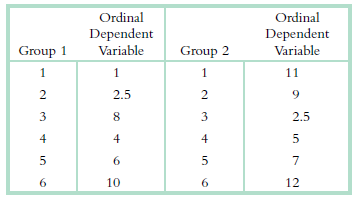
Consider the following scale data.a. Convert the data to ordinal or ranked data, starting with a rank of 1 for the smallest data point. b. Compute the Spearman correlation coefficient. Ordinal Dependent Ordinal Dependent Variable Group 1 Variable Group 2 1 11 2.5 9. 8. 3 2.5 12 6. 10
Below are some data to use in a chi-square test for independence.a. Calculate the degrees of freedom for this test. b. Complete this table of expected frequencies.c. Calculate the test statistic. d. Calculate the appropriate measure of effect size. e. Calculate the relative
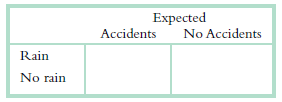
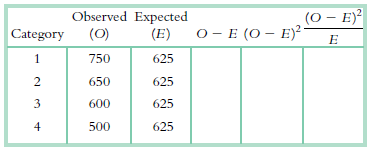
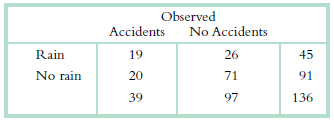
Use this calculation table for the chi-square test for goodness of fit to complete this exercisea. Calculate degrees of freedom for this chi-square test for goodness of fit. b. Perform all of the calculations to complete this table.c. Compute the chi-square statistic. Expected Accidents No
For each of the following, (i) identify the incorrect symbol, (ii) state what the correct symbol should be, and (iii) explain why the initial symbol was incorrect. a. For the chi-square test for goodness of fit: df χ2 = N ˆ’ 1 b. For the chi-square test for
For each of the following, identify the independent variable(s), the dependent variable(s), and the level of measurement (nominal, ordinal, scale).a. The number of loads of laundry washed per month was tracked for women and men living in college dorms. b. A researcher interested in people’s
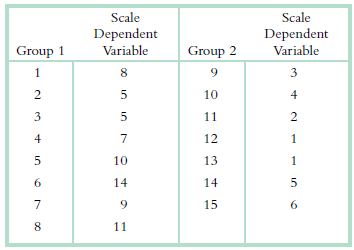
Consider the following scale data.a. Convert the data to ordinal or ranked data, starting with a rank of 1 for the smallest data point. b. Compute the Spearman correlation coefficient. Scale Scale Dependent Variable Dependent Group 1 Variable Group 2 3 5 10 3 11 4 12 10 13 6. 14 14 15 6. 8. 11
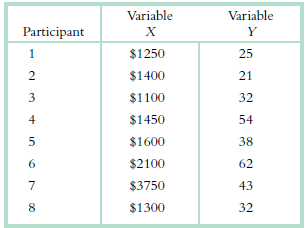
In order to comp ute statistics, we need to have working formulas. For the following, (i) identify the incorrect symbol, (ii) state what the correct symbol should be, and (iii) explain why the initial symbol was incorrect. a.b. Variable Variable Participant $1250 25 2 $1400 21
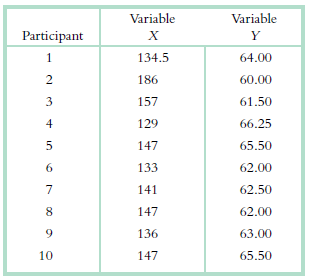
The data below are from a study of lung cancer patients in Turkey (Yilmaz et al., 2000). Use these data to calculate the relative likelihood of the patient being a smoker, given that a person is female rather than male. Variable Variable Participant 134.5 64.00 186 60.00 3 157 61.50 129 66.25 147
If the data meet the assumptions of the parametric test, why is it preferable to use the parametric test rather than the nonparametric alternative?
How are the critical values for the Mann–Whitney U test used differently than critical values for parametric tests?
What are the assumptions of the Mann–Whitney U test?
When do we use the Mann–Whitney U test?
When is it appropriate to use the Wilcoxon signed-rank test?
How would you respond in a situation in which you are ranking a set of scale data and there are two numbers that are exactly the same?
What is the possible range of values for the Spearman rank-order corre lation and how are these values interpreted?
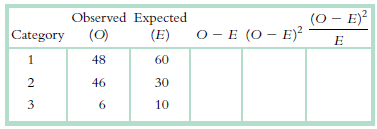
Define the symbols in the following term: Observed Expected (E) (0 - E)? O - E (O – E)² (0) Category 48 1. 60 46 30 3 6. 10
Explain how the relation between ranks is the core of the Spearman rank-order correlation.
What does a histogram of rank-ordered data look like and why does it look that way?
How does the transformation of scale data to ordinal data solve the problem of outliers?
When the data on at least one variable are ordinal, the data on any scale variable must be converted from scale to ordinal. How do we c onvert a scale variable into an ordinal one?
When do we convert scale data to ordinal data?
Why can relative likelihood and relative risk sometimes exaggerate risks?
Showing 1700 - 1800
of 2375
First
10
11
12
13
14
15
16
17
18
19
20
21
22
23
24
Step by Step Answers