New Semester
Started
Get
50% OFF
Study Help!
--h --m --s
Claim Now
Question Answers
Textbooks
Find textbooks, questions and answers
Oops, something went wrong!
Change your search query and then try again
S
Books
FREE
Study Help
Expert Questions
Accounting
General Management
Mathematics
Finance
Organizational Behaviour
Law
Physics
Operating System
Management Leadership
Sociology
Programming
Marketing
Database
Computer Network
Economics
Textbooks Solutions
Accounting
Managerial Accounting
Management Leadership
Cost Accounting
Statistics
Business Law
Corporate Finance
Finance
Economics
Auditing
Tutors
Online Tutors
Find a Tutor
Hire a Tutor
Become a Tutor
AI Tutor
AI Study Planner
NEW
Sell Books
Search
Search
Sign In
Register
study help
engineering
introduction mechanical engineering
Introduction To MATLAB For Engineers 3rd Edition William Palm III - Solutions
The equation describing the water height h in a spherical tank with a drain at the bottom isSuppose the tank’s radius is r = 3 m and the circular drain hole has a radius of 2 cm. Assume that Cd = 0.5 and that the initial water height is h(0) = 5 m. Use g = 9.81 m/s2.a. Use an approximation to
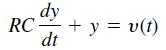
The equation for the voltage y across the capacitor of an RC circuit is where !(t) is the applied voltage. Suppose that RC = 0.2 s and that the capacitor voltage is initially 2 V. Suppose also that the applied voltage is υ(t) = 10[2 – e–t sin(5πt)] V. Plot the voltage y(t) for 0 ≤ t
The following equation describes the motion of a mass connected to a spring, with viscous friction on the surface. Plot y(t) for y(0) = 10, ẏ(0) = 5 ifa. m = 3, c = 18, and k = 102b. m = 3, c = 39 and k = 120 тӱ + сӯ + kу %3D 0 су + ky
The following equation describes the temperature T(t) of a certain object immersed in a liquid bath of constant temperature Tb. Suppose the object’s temperature is initially T(0) = 70°F and the bath temperature is Tb = 170°F.a. How long will it take for the object’s temperature T to
The equation for the voltage y across the capacitor of an RC circuit is where υ(t) is the applied voltage. Suppose that RC = 0.2 s and that the capacitor voltage is initially 2 V. Suppose also that the applied voltage goes from 0 to 10 V at t = 0. Plot the voltage y(t) for 0 ≤ t ≤ 1 s. dy
The equation of motion of a rocket-propelled sled is, from Newton’s law,mυ = f – cυwhere m is the sled mass, f is the rocket thrust, and c is an air resistance coefficient. Suppose that m = 1000 kg and c = 500 N 0 s/m. Suppose also that υ(0) = 0 and f = 75,000 N for t ≥ 0. Determine the
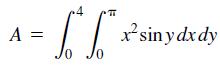
Compute the double integral A = xsinydxdy
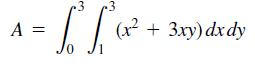
Compute the double integral A = (x² + 3xy) dxdy 1.
Compute the indefinite integral of p(x) = 5x2 – 9x + 8.
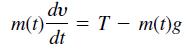
A rocket’s mass decreases as it burns fuel. The equation of motion for a rocket in vertical flight can be obtained from Newton’ s law, and it is where T is the rocket’s thrust and its mass as a function of time is given by m(t) = m0(1 – rt/b). The rocket’s initial mass is m0, the
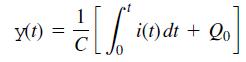
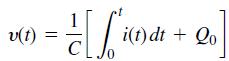
The equation for the voltage υ(t) across a capacitor as a function of time is where i(t) is the applied current and Q0 is the initial charge. Suppose that C = 10–7 F and that Q0 = 0. Suppose the applied current is i(t) = 0.3 + 0.1e–5t sin(25πt) A. Plot the voltage υ(t) for 0 ≤ t ≤ 7
A certain object has a mass of 100 kg and is acted on by a forcef(t) = 500[2 – e–t sin(5πt)] N. The mass is at rest at t = 0. Determine the object’s velocity at t = 5 s.
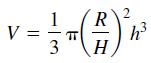
A cone-shaped paper drinking cup (like the kind supplied at water fountains) has a radius R and a height H. If the water height in the cup is h, the water volume is given by Suppose that the cup’s dimensions are R = 1.5 in. and H = 4 in.a. If the flow rate from the fountain into the cup is 2
A tank having vertical sides and a bottom area of 100 ft2 is used to store water. The tank is initially empty. To fill the tank, water is pumped into the top at the rate given in the following table. Determine the water height h(t) at t = 10 min. Time (min) 1 3 4 7 8 10 Flow rate (ft'/min) 80 130
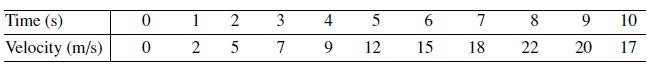
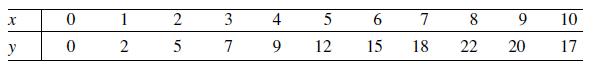
A certain object moves with the velocity υ(t) given in the table below. Determine the object’s position x(t) at t = 10 s if x(0) = 3. Time (s) 1 3 4 5 7 8 9. 10 Velocity (m/s) 2 5 7 12 15 18 22 20 17
A certain object’s acceleration is given by a(t) = 7t sin 5t m/s2. Compute its velocity at t = 10 s if its initial velocity is zero.
The equation for the voltage υ(t) across a capacitor as a function of time is where i(t) is the applied current and Q0 is the initial charge. A certain capacitor initially holds no charge. Its capacitance is C = 10–7 F. If a current i(t) = 0.2[1 % sin (0.2t)] A is applied to the capacitor,
An object starts with an initial velocity of 3 m/s at t = 0, and it accelerates with an acceleration of a(t) = 7t m/s2. Find the total distance the object travels in 4 s.
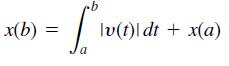
The total distance traveled by an object moving at velocity υ(t) from the time t " a to the time t = b is The absolute value |υ(t)| is used to account for the possibility that υ(t) might be negative. Suppose an object starts at time t = 0 and moves with a velocity of υ(t) = cos(πt) m.
An object moves at a velocity υ(t) = 5 + 7t2 m/s starting from the position x(2) = 5 m at t = 2 s. Determine its position at t = 10 s.
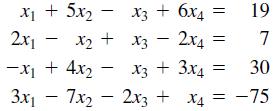
Use the MATLAB program given in Table 8.5–2 to solve the following problems:a. Problem 3dd.b. Problem 11Solve the following equations:c. Problem 14Use MATLAB to solve the following problem:x - 3y = 2x + 5y = 184x - 6y = 20d. Problem 15Use MATLAB to solve the following problem:x - 3y = 2x + 5y =
a. Use MATLAB to find the coefficients of the quadratic polynomial y = ax2 + bx + c that passes through the three points (x, y) = (1, 4), (4, 73), (5, 120).b. Use MATLAB to find the coefficients of the cubic polynomial y = ax3 + bx2 + cx + d that passes through the three points given in part a.
Use MATLAB to solve the following problem:x - 3y = 2x + 5y = 184x - 6y = 10
Construct a Simulink model of the following problem. The forcing function iswhere g(t) = 10 sin 4t. 5x + sin x = = f(t) x(0) = 0
Plot the solution of the equation6ẏ + y = f(t)if f (t) = 0 for t + 0 and f(t) = 15 for t ≥ 0. The initial condition is y(0) = 7.
Plot the contour plot and the gradient (shown by arrows) for the functionf(x, y) = -x2 + 2xy + 3y2
Compute the expressions for dp2/dx, d(p1p2)/dx, and d( p2/p1)/dx for p1 = 5x2 + 7 and p2 = 5x2 – 6x + 7.
Compare the performance of the forward, backward, and central difference methods for estimating the derivative of y(x) = e–x sin(3x). Use 101 points from x = 0 to x = 4. Use a random additive error of ±0.01.
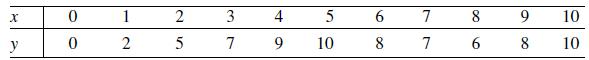
At a relative maximum of a curve y(x), the slope dy/dx is zero. Use the following data to estimate the values of x and y that correspond to a maximum point. 1 3 4 6. 7 8 9. 10 y 7 9 10 8 7 6. 8 10 2.
Plot the estimate of the derivative dy"dx from the following data. Do this by using forward, backward, and central differences. Compare the results. 1 3 4 6 7 8 9. 10 y 7 9. 12 15 18 22 20 17 2. 2.
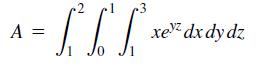
Compute the triple integral A = xe dxdy dz Jo Ji 0, 2.
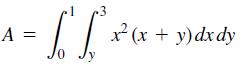
Compute the double integralNote that the region of integration lies to the right of the line y = x. Use this fact and a MATLAB relational operator to eliminate values for which y > x. A = 2 (x + y)dxdy y
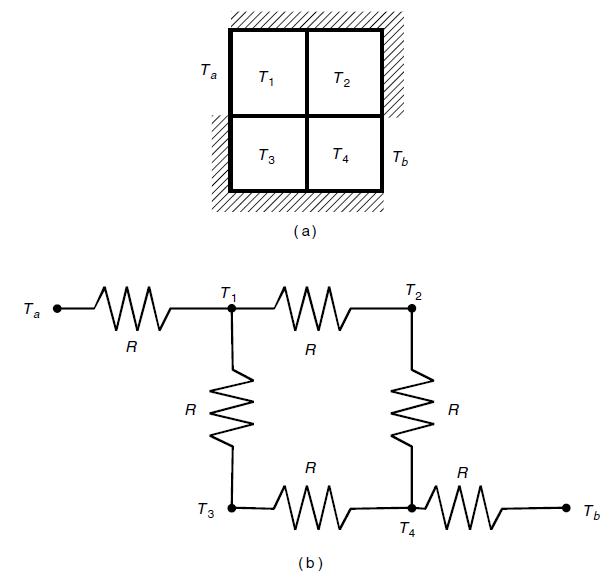
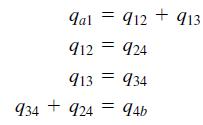
The concept of thermal resistance described in Problem 8 can be used to find the temperature distribution in the at square plate shown in Figure P9(a).Figure P9 The plate’s edges are insulated so that no heat can escape, except at two points where the edge temperature is heated to Ta and Tb,
Use MATLAB to solve the following problem:x - 3y = 2x + 5y = 184x - 6y = 20
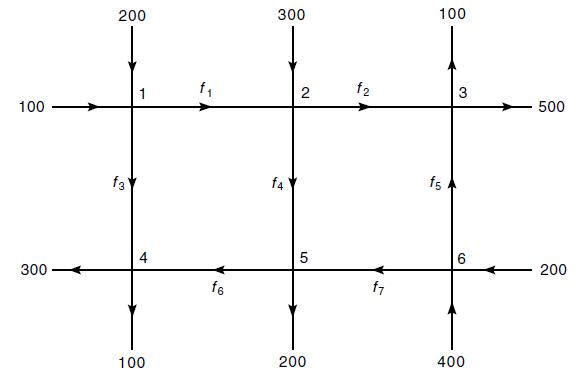
See Figure P13. Assume that no vehicles stop within the network. A traffic engineer wants to know if the traffic flows f1, f2, . . . , f7 (in vehicles per hour) can be computed given the measured flows shown in the figure. If not, then determine how many more traffic sensors need to be installed,
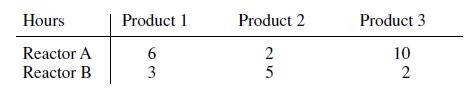
The following table shows how many hours in process reactors A and B are required to produce 1 ton each of chemical products 1, 2, and 3. The two reactors are available for 35 and 40 hrs per week, respectively.Let x, y, and z be the number of tons each of products 1, 2, and 3 that can be produced
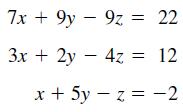
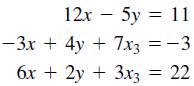
Solve the following equations: 7x + 9y – 9z = 22 Зх + 2y — 4z = 12 х + 5у — z %3D -2 Z.
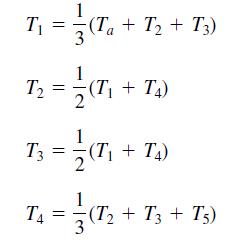
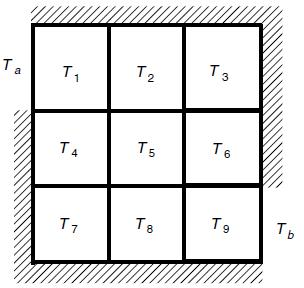
Use the averaging principle developed in Problem 9 to find the temperature distribution of the plate shown in Figure P10, using the 3 × 3 grid and the given values Ta = 150°C and Tb = 20°C.Figure P10 T3 T2 イ。 a T6 T5 T4 Ть b. T8 イ1 ド
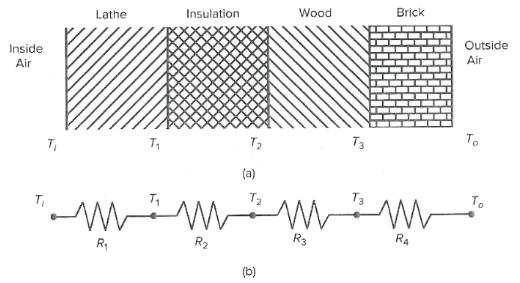
Engineers must be able to predict the rate of heat loss through a building wall to determine the heating system requirements. They do this by using the concept of thermal resistance R, which relates the heat flow rate q through a material to the temperature difference /T across the material: q=
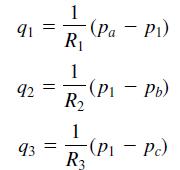
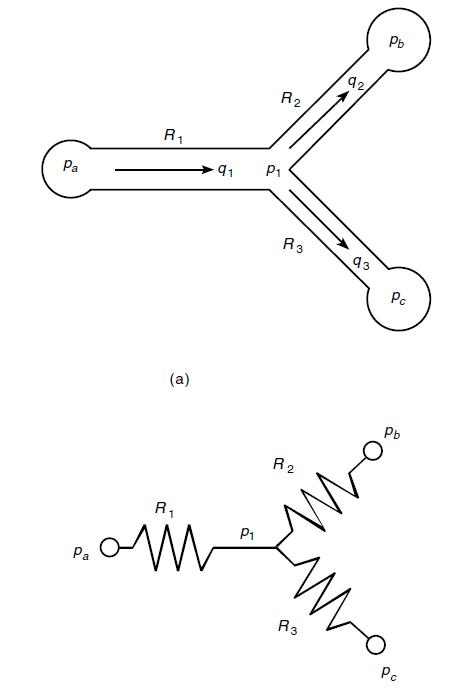
Fluid flows in pipe networks can be analyzed in a manner similar to that used for electric resistance networks. Figure P6 shows a network with three pipes. The volume flow rates in the pipes are q1, q2, and q3. The pressures at the pipe ends are pa, pb, and pc. The pressure at the junction is p1.
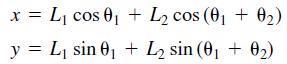
Figure P7 illustrates a robot arm that has two “links” connected by two “joints”—a shoulder or base joint and an elbow joint. There is a motor at each joint. The joint angles are θ1 and θ2. The (x, y) coordinates of the hand at the end of the arm are given by where L1 and L2 are
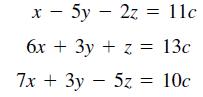
a. Use MATLAB to solve the following equations for x, y, and z as functions of the parameter c. b. Plot the solutions for x, y, and z versus c on the same plot, for $10 ≤ c ≤ 10. х — 5у — 2z %3D 11с бх + Зу + z%3D 13с 7x + 3y 5z = 10c
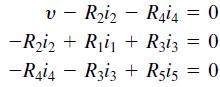
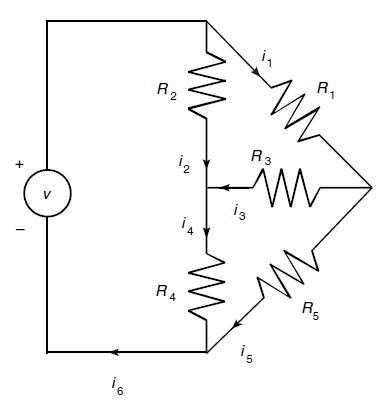
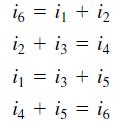
The circuit shown in Figure P4 has five resistances and one applied voltage. Kirchhoff’s voltage law applied to each loop in the circuit shown gives Figure P4Conservation of charge applied at each node in the circuit givesa. Write a MATLAB script le that uses given values of the applied
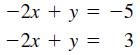
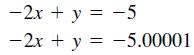
Use MATLAB to solve the following problems.a. b.c.d. -2x + y = -5 -2x + y = 3
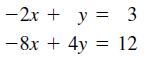
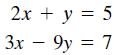
Solve the following problems using matrix inversion. Check your solutions by computing A-1A.a. b.c.d. 2х + у %3D 5 = 5 Зх — 9у 3 7
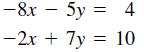
a. Solve the following matrix equation for the matrix C.A(BC + A) = Bb. Evaluate the solution obtained in part a for the case 7 9 4 -3 A = -2 4. B = 7 6 ]
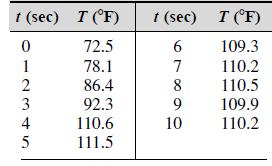
The following data are the measured temperature T of water owing from a hot water faucet after it is turned on at time t = 0.a. Plot the data, connecting them rst with straight lines and then with a cubic spline.b. Estimate the temperature values at the following times, using linear interpolation
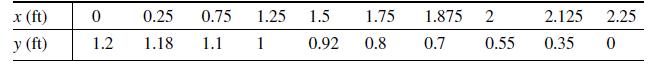
Computer-controlled machines are used to cut and to form metal and other materials when manufacturing products. These machines often use cubic splines to specify the path to be cut or the contour of the part to be shaped. The following coodinates specify the shape of a certain car’s front fender.
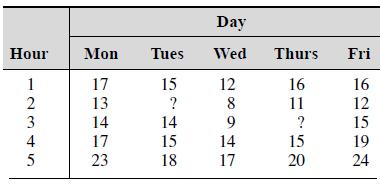
The following table gives temperature data in *C as a function of time of day and day of the week at a specific location. Data are missing for the entries marked with a question mark (?). Use linear interpolation with MATLAB to estimate the temperature at the missing points. Day Hour Mon Tues Wed
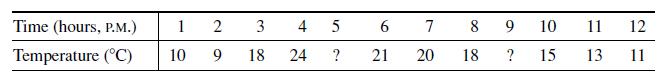
Interpolation is useful when one or more data points are missing. This situation often occurs with environmental measurements, such as temperature, because of the difficulty of making measurements around the clock. The following table of temperature versus time data is missing readings at 5 and 9
Write a script le to play a simple number guessing game as follows. The script should generate a random integer in the range 1, 2, 3, . . . , 14, 15. It should provide for the player to make repeated guesses of the number, and it should indicate if the player has won or give the player a hint after
Write a script le to simulate 100 plays of a game in which you ip two coins. You win the game if you get two heads, lose if you get two tails, and ip again if you get one head and one tail. Create three user -defined functions to use in the script. Function ip simulates the ip of one coin, with the
Suppose that data show that a certain stock price is normally distributed with a mean of $150 and a variance of 100. Create a simulation to compare the results of the following two strategies over 250 days. You start the year with 1000 shares. With the first strategy , every day the price is below
Suppose you have analyzed the price behavior of a certain stock by plotting the scaled frequency histogram of the price over a number of months. Suppose that the histogram indicates that the price is normally distributed with a mean $100 and a standard deviation of $5. Write a MATLAB program to
Suppose that y = x2, where x is a normally distributed random variable with a mean and variance of µx = 0 and σ2x = 4. Find the mean and variance of y by simulation. Does µy = µ2x? Does σy = σ2x? Do this for 100, 1000, and 5000 trials.
Obtain the surface and contour plots for the function z = -x2 + 2xy + 3y2. This surface has the shape of a saddle. At its saddlepoint at x = y = 0, the surface has zero slope, but this point does not correspond to either a minimum or a maximum. What type of contour lines corresponds to a
The mean of the sum (or difference) of two independent random variables equals the sum (or difference) of their means, but the variance is always the sum of the two variances. Use random number generation to verify this statement for the case where z = x + y, where x and y are independent and
Use a random number generator to produce 1000 normally distributed numbers with a mean of 20 and a variance of 4. Obtain the mean, variance, and histogram of these numbers, and discuss whether they appear normally distributed with the desired mean and variance.
Use a random number generator to produce 1000 uniformly distributed numbers with a mean of 10, a minimum of 2, and a maximum of 18. Obtain the mean and the histogram of these numbers, and discuss whether they appear uniformly distributed with the desired mean.
Suppose that z = xy, where x and y are independent and normally distributed random variables. The mean and variance of x are µx = 10 and σ2x = 2. The mean and variance of y are µy = 15 and σ2y = 3. Find the mean and variance of z by simulation. Does µz = µxµy? Does σ2z = σ2x σ2y? Do this
A certain product is assembled by placing three components end to end. The components’ lengths are L1, L2, and L3. Each component is manufactured on a different machine, so the random variations in their lengths are independent of one another. The lengths are normally distributed with means of 1,
A shipping pallet holds 10 boxes. Each box holds 300 parts of different types. The part weight is normally distributed with a mean of 1 lb and a standard deviation of 0.2 lb.a. Compute the mean and standard deviation of the pallet weight.b. Compute the probability that the pallet weight will exceed
A certain product requires that a shaft be inserted into a bearing. Measurements show that the diameter d1 of the cylindrical hole in the bearing is normally distributed with a mean of 3 cm and a variance of 0.0064. The diameter d2 of the shaft is normally distributed with a mean of 2.96 cm and a
Measurements of a number of fittings show that the pitch diameter of the thread is normally distributed with a mean of 8.007 mm and a standard deviation of 0.005 mm. The design specifications require that the pitch diameter be 8 ± 0.01 mm. Estimate the percentage of fittings that will be within
Data from service records show that the time to repair a certain machine is normally distributed with a mean of 65 min and a standard deviation of 5 min. Estimate how often it will take more than 75 min to repair a machine.
For the data given in Problem 3:a. Plot the scaled frequency histogram.b. Compute the mean and standard deviation, and use them to estimate the lower and upper limits of breaking force corresponding to 68 and 96 percent of cord pieces of this type. Compare these limits with those of the
Data analysis of the breaking strength of a certain fabric shows that it is normally distributed with a mean of 300 lb and a variance of 9.a. Estimate the percentage of fabric samples that will have a breaking strength no less than 294 lb.b. Estimate the percentage of fabric samples that will have
For the data given in Problem 2:a. Plot the scaled frequency histogram.b. Compute the mean and standard deviation and use them to estimate the lower and upper limits of strength corresponding to 68 and 96 percent of such timber pieces. Compare these limits with those of the data.Problem 2Thirty
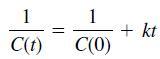
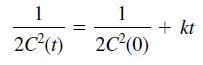
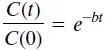
Chemists and engineers must be able to predict the changes in chemical concentration in a reaction. A model used for many single-reactant processes isRate of change of concentration = -kCnwhere C is the chemical concentration and k is the rate constant. The order of the reaction is the value of the
For the data given in Problem 1:a. Plot the scaled frequency histogram.b. Compute the mean and standard deviation and use them to estimate the lower and upper limits of gas mileage corresponding to 68 percent of cars of this model. Compare these limits with those of the data.Problem 1The following
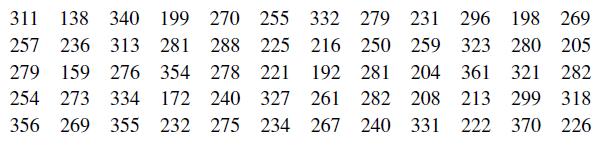
The following list gives the measured breaking force in newtons for a sample of 60 pieces of certain type of cord. Plot the absolute frequency histogram. Try bin widths of 10, 30, and 50 N. Which gives the most meaningful histogram? Try to find a better value for the bin width. 311 138 340 199 270
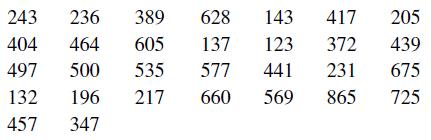
Thirty pieces of structural timber of the same dimensions were subjected to an increasing lateral force until they broke. The measured force in pounds required to break them is given in the following list. Plot the absolute frequency histogram. Try bin widths of 50, 100, and 200 lb. Which gives the
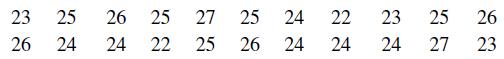
The following list gives the measured gas mileage in miles per gallon for 22 cars of the same model. Plot the absolute frequency histogram and the relative frequency histogram. 23 25 26 25 27 25 24 22 23 25 26 26 24 24 22 25 26 24 24 24 27 23
Chemists and engineers must be able to predict the changes in chemical concentration in a reaction. A model used for many singlereactant processes isRate of change of concentration = -kCnwhere C is the chemical concentration and k is the rate constant. The order of the reaction is the value of the
Chemists and engineers must be able to predict the changes in chemical concentration in a reaction. A model used for many single-reactant processes isRate of change of concentration = -kCnwhere C is the chemical concentration and k is the rate constant. The order of the reaction is the value of the
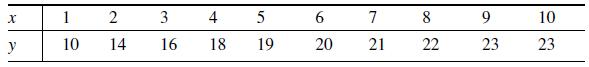
The following function is linear in the parameters a1 and a2.y(x) = a1 + a2 ln xUse least-squares regression with the following data to estimate the values of a1 and a2. Use the curve t to estimate the values of y at x = 2.5 and at x = 11. 1 2 3 4 5 7 8. 9. 10 y 10 14 16 18 19 20 21 22 23 23
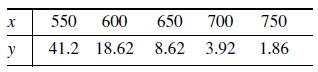
The solubility of oxygen in water is a function of the water temperature. Let S represent the solubility of O2 as millimoles of O2 per liter of water. Let T be temperature in 'C. Use the following data to obtain a curve t for S as a function of T. Use the t to estimate S when T = 8°C and T =
The solubility of salt in water is a function of the water temperature. Let S represent the solubility of NaCl (sodium chloride) as grams of salt in 100 g of water. Let T be temperature in °C. Use the following data to obtain a curve t for S as a function of T. Use the t to estimate S when T =
A liquid boils when its vapor pressure equals the external pressure acting on the surface of the liquid. This is why water boils at a lower temperature at higher altitudes. This information is important for people who must design processes utilizing boiling liquids. Data on the vapor pressure P of
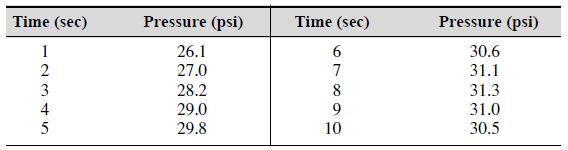
The following represents pressure samples, in pounds per square inch (psi), taken in a fuel line once every second for 10 sec.a. Fit a first-degree polynomial, a second-degree polynomial, and a third-degree polynomial to these data. Plot the curve ts along with the data points.b. Use the results
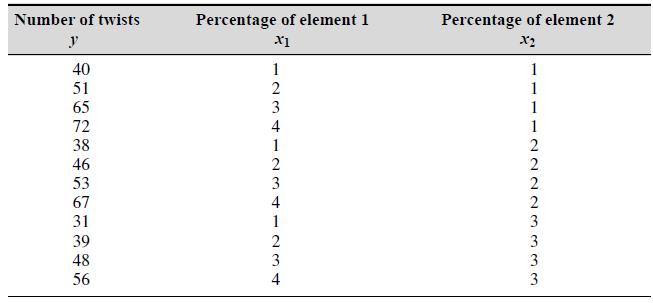
The number of twists y required to break a certain rod is a function of the percentage x1 and x2 of each of two alloying elements present in the rod. The following table gives some pertinent data. Use linear multiple regression to obtain a model y = a0 + a1x1 + a2x2 of the relationship between the
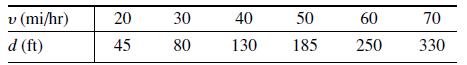
The following data give the stopping distance d as a function of initial speed υ, for a certain car model. Find a quadratic polynomial that fits the data. Determine the quality of the curve t by computing J, S, and r2. v (mi/hr) 20 30 40 50 60 70 d (ft) 45 80 130 185 250 330
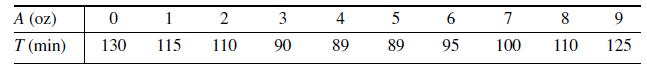
The following data give the drying time T of a certain paint as a function of the amount of a certain additive A.a. Find the first-, second-, third-, and fourth-degree polynomials that t the data, and plot each polynomial with the data. Determine the quality of the curve t for each by computing J,
The distance a spring stretches from its free length is a function of how much tension force is applied to it. The following table gives the spring length y that was produced in a particular spring by the given applied force f. The spring’s free length is 4.7 in. Find a functional relation
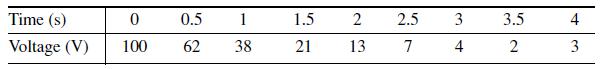
A certain electric circuit has a resistor and a capacitor. The capacitor is initially charged to 100 V. When the power supply is detached, the capacitor voltage decays with time, as the following data table shows. Find a functional description of the capacitor voltage υ as a function of time t.
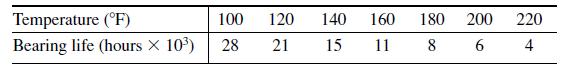
The useful life of a machine bearing depends on its operating temperature, as the following data show. Obtain a functional description of these data. Plot the function and the data on the same plot. Estimate a bearing’s life if it operates at 150°F. Temperature (°F) 100 120 140 160 180 200 220
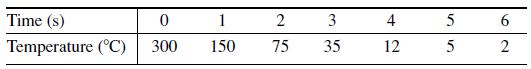
Quenching is the process of immersing a hot metal object in a bath for a specified time to obtain certain properties such as hardness. A copper sphere 25 mm in diameter, initially at 300°C, is immersed in a bath at 0°C. The following table gives measurements of the sphere’s temperature versus
The half-life of a radioactive substance is the time it takes to decay by one-half. The half-life of carbon 14, which is used for dating previously living things, is 5500 years. When an organism dies, it stops accumulating carbon 14. The carbon 14 present at the time of death decays with time. Let
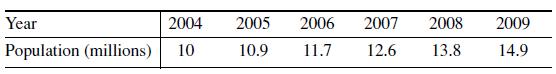
The population data for a certain country are as follows:Obtain a function that describes these data. Plot the function and the data on the same plot. Estimate when the population will be double its 2004 size. Year 2004 2005 2006 2007 2008 2009 Population (millions) 10 10.9 11.7 12.6 13.8 14.9
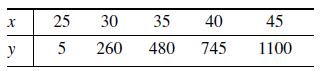
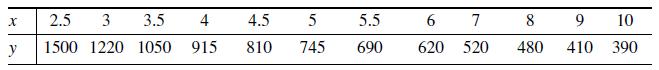
In each of the following problems, determine the best function y(x) (linear, exponential, or power function) to describe the data. Plot the function on the same plot with the data. Label and format the plots appropriately.a.b.c. 25 30 35 40 45 y 260 480 745 1100
The distance a spring stretches from its “free length” is a function of how much tension force is applied to it. The following table gives the spring length y that the given applied force f produced in a particular spring. The spring’s free length is 4.7 in. Find a functional relation between
Refer to Example 3.2–1. Use a surface plot and a contour plot of the perimeter length L as a function of d and θ over the ranges 1 ≤ d ≤ 30 ft and 0.1 ≤ θ ≤ 1.5 rad. Are there valleys other than the one corresponding to d = 7.5984 and θ = 1.0472? Are there any saddle points?
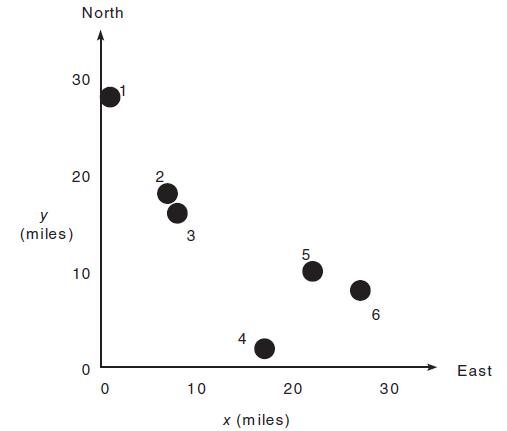
Refer to Problem 28 of Chapter 4. To see how sensitive the cost is to location of the distribution center, obtain a surface plot and a contour plot of the total cost as a function of the x and y coordinates of the distribution center location. How much would the cost increase if we located the
Refer to Problem 25 of Chapter 4. Use the function file created for that problem to generate a surface mesh plot and a contour plot of x versus h and W for 0 ≤ W ≤ 500 N and for 0 ≤ h ≤ 2 m. Use the values k1 = 104 N/m, k2 = 1.5 × 10⁴ N/m, and d = 0.1 m.Problem 25Figure P25 is a
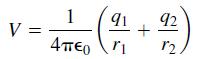
The electric potential field V at a point, due to two charged particles, is given by where q1 and q2 are the charges of the particles in coulombs (C), r1 and r2 are the distances of the charges from the point (in meters), and ,0 is the permittivity of free space, whose value isSuppose the
The following function describes oscillations in some mechanical structures and electric circuits. In this function t is time, and ω is the oscillation frequency in radians per unit time. The oscillations have a period of 2π/ω, and their amplitudes decay in time at a rate
The following equation describes the temperature distribution in a at rectangular metal plate. The temperature on three sides is held constant at T1, and at T2 on the fourth side (see Figure P35). The temperature T (x, y) as a function of the xy coordinates shown is given by WhereThe given
A square metal plate is heated to 80°C at the corner corresponding to x = y = 1. The temperature distribution in the plate is described by Obtain the surface and contour plots for the temperature. Label each axis. What is the temperature at the corner corresponding to x = y = 0? T = 80e (r-1
Obtain the surface and contour plots for the function z = (x - y2)(x - 3y2). This surface has a singular point at x = y = 0, where the surface has zero slope, but this point does not correspond to either a minimum or a maximum. What type of contour lines corresponds to a singular point?
Obtain the surface and contour plots for the function z = x2 = -2xy + 4y2, showing the minimum at x = y = 0.
Showing 4000 - 4100
of 4547
First
32
33
34
35
36
37
38
39
40
41
42
43
44
45
46
Step by Step Answers


![7 9 4 -3 A = -2 4. B = 7 6 ]](https://dsd5zvtm8ll6.cloudfront.net/si.question.images/images/question_images/1594/0/2/1/3185f02d5c6eff951594021318389.jpg)