New Semester
Started
Get
50% OFF
Study Help!
--h --m --s
Claim Now
Question Answers
Textbooks
Find textbooks, questions and answers
Oops, something went wrong!
Change your search query and then try again
S
Books
FREE
Study Help
Expert Questions
Accounting
General Management
Mathematics
Finance
Organizational Behaviour
Law
Physics
Operating System
Management Leadership
Sociology
Programming
Marketing
Database
Computer Network
Economics
Textbooks Solutions
Accounting
Managerial Accounting
Management Leadership
Cost Accounting
Statistics
Business Law
Corporate Finance
Finance
Economics
Auditing
Tutors
Online Tutors
Find a Tutor
Hire a Tutor
Become a Tutor
AI Tutor
AI Study Planner
NEW
Sell Books
Search
Search
Sign In
Register
study help
mathematics
essential statistics business
Essential Statistics 2nd Edition Robert Gould, Colleen N. Ryan, Rebecca Wong - Solutions
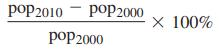
Data were recorded for each of the 50 U.S. states: the state, its population in 2000, its population in 2010, and the region in which it is located (Northeast, Midwest, South, or West). Find the percentage population increase for each state by applying the following formula: Write a few
An exam has a mean of 70 and a standard deviation of 10. What exam score corresponds to a z-score of 1.5?
Three-year-old boys in the United States have a mean height of 38 inches and a standard deviation of 2 inches. How tall is a three-year-old boy with a z-score of -1.0?
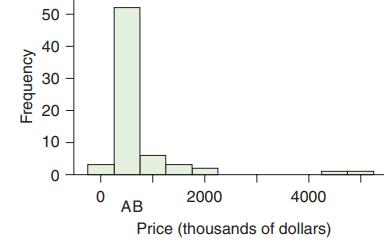
The figure, which is from data taken from the Ventura County Star, shows a histogram of house prices in Thousand Oaks, California, in 2009. The location of the mean and median are marked with letters. Which is the location of the mean, A or B? Explain why the mean and median are not the same.
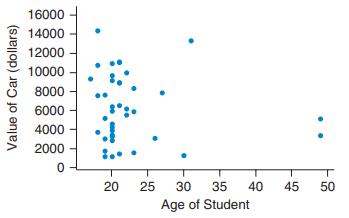
The scatterplot shows the age of students and the value of their cars according to the Kelley Blue Book. Does it show an increasing trend, a decreasing trend, or very little trend? Explain. 16000 14000 12000 10000 8000 6000 4000 2000 :.. 20 25 30 35 40 45 50 Age of Student Value of Car
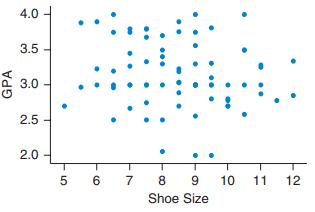
The figure shows a scatterplot of shoe size and GPA for some college students. Does it show an increasing trend, a decreasing trend, or no trend? Is there a strong relationship? 4.0 3.5 3.0 2.5 2.0 6 7 8 10 11 12 Shoe Size .. .... .. GPA
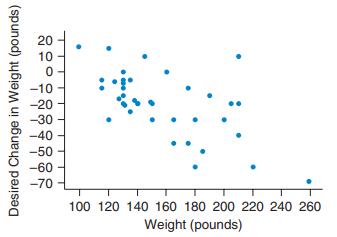
The scatterplot shows the actual weight and desired weight change of some students. Thus, if a student weighed 220 and wanted to weigh 190, the desired weight change would be negative 30. Explain what you see. In particular, what does it mean that the trend is negative? 20 10 -10 -20 -30
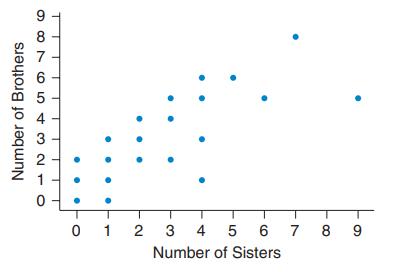
The scatterplot shows the numbers of brothers and sisters for a large number of students. Do you think the trend is somewhat positive or somewhat negative? What does the direction (positive or negative) of the trend mean? Does the direction make sense in this context? 6 3 1 0 1 3 4 5 6 7 8 9
The scatterplot shows data from the 50 states taken from the U.S. Census—the percentage of the population (25 years or older) with a college degree or higher and the median family income. Describe and interpret the trend. (The outlier is Colorado.)
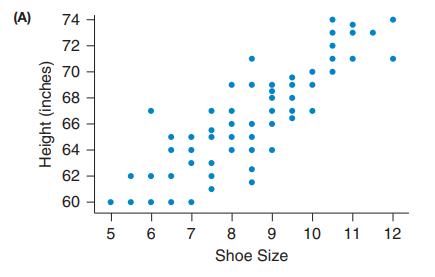
Match each of the following correlations with the corresponding graph. 0.87 _________ -0.47 _________ 0.67 _________ (A) 74 72 70 68 66 64 62 60 6 8 10 11 12 Shoe Size Height (inches)
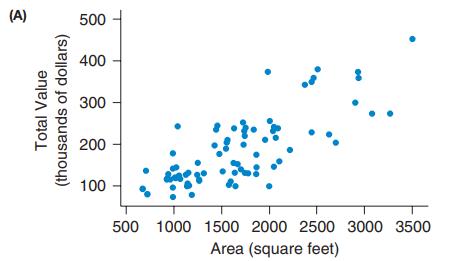
Pick the letter of the graph that goes with each numerical value listed below for the correlation. Correlations: 0.767 _________ 0.299 _________ -0.980 _________ (A) 500 400 300 200 100 500 1000 1500 2000 2500 3000 3500 Area (square feet) Total Value (thousands of dollars)
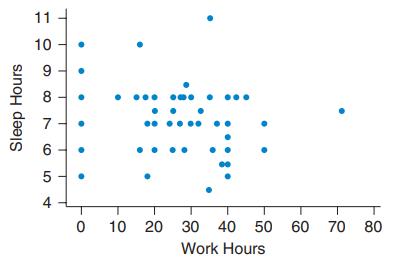
The scatterplot shows the number of hours of work per week and the number of hours of sleep per night for some college students. Does the graph show a strong increasing trend, a strong decreasing trend, or very little trend? Explain. 11 10 9. 8 4 O 10 20 30 40 50 60 70 80 Work Hours Sleep
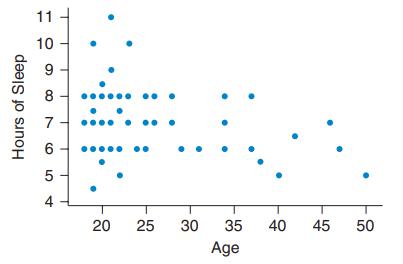
The scatterplot shows the age and number of hours of sleep “last night” for some students. Do you think the trend is slightly positive or slightly negative? What does that mean? 11 10 9. 8 7 6 20 25 30 35 40 45 50 Age Hours of Sleep 4.
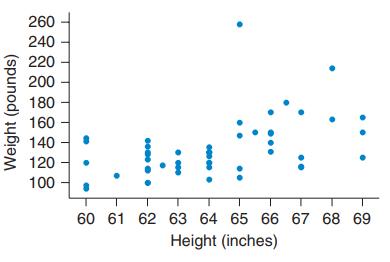
The figure shows a scatterplot of the heights and weights of some women taking statistics. Describe what you see. Is the trend positive, negative, or near zero? Explain 260 240 220 200 180 160 140 120 100 60 61 62 63 64 65 66 67 68 69 Height (inches) Weight (pounds) ..
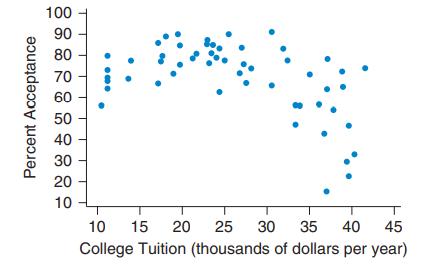
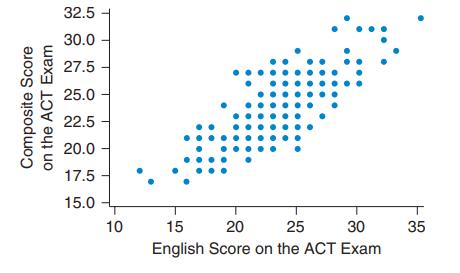
a. The first scatterplot shows the college tuition and percentage acceptance at some colleges in Massachusetts. Would it make sense to find the correlation using this data set? Why or why not? b. The second scatterplot shows the composite grade on the ACT (American College Testing) exam and
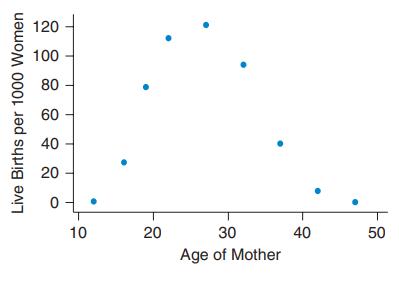
The figure shows a scatterplot of birthrate (live births per 1000 women) and age of the mother in the United States. Would it make sense to find the correlation for this data set? Explain. According to this graph, at approximately what age does the highest fertility rate occur? 120 100 80 60
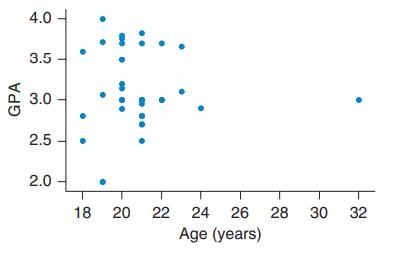
On the basis of the scatterplot, do you think that the correlation coefficient between age and GPA for this figure is positive, negative, or near zero? 4.0 3.5 3.0 2.5 2.0 18 20 22 24 26 28 30 32 Age (years) GPA
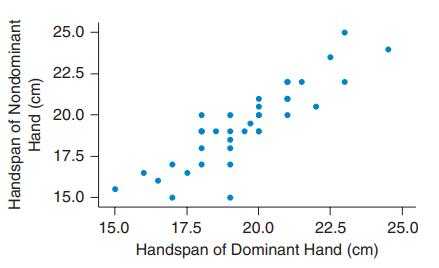
a. Would it make sense to find the correlation with this data set? Why or why not? b. Would the correlation be positive, negative, or near 0? 25.0 22.5 20.0 17.5 - 15.0 15.0 17.5 20.0 22.5 25.0 Handspan of Dominant Hand (cm) Handspan of Nondominant Hand (cm)
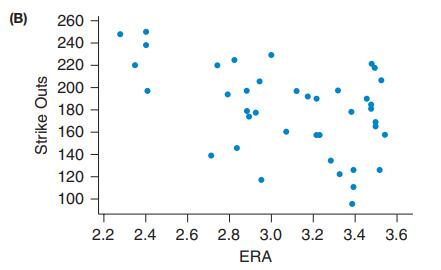
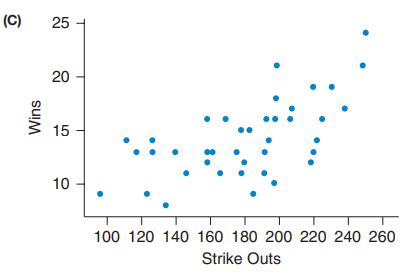
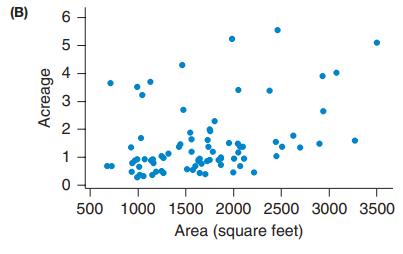
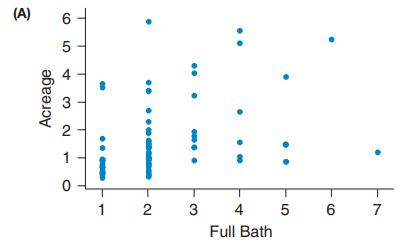
Pick the letter of the graph that goes with each numerical value listed below for the correlation. Correlations: -0.903 _________ 0.374 _________ 0.777 _________ (A) 6 1 1 2 3 4 6 7 Full Bath Acreage 4.
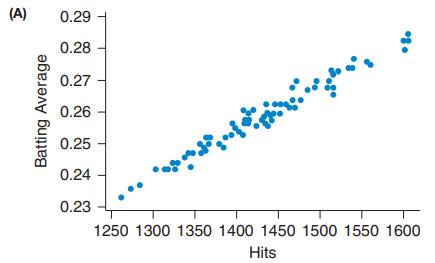
Match each of the following correlations with the corresponding graph. -0.51 _________ 0.98 _________ 0.18 _________ (A) 0.29 0.28 0.27 0.26 0.25 0.24 0.23 1250 1300 1350 1400 1450 1500 1550 1600 Hits Batting Average
The correlation between height and armspan in a sample of adult women was found to be r = 0.948. The correlation between armspan and height in a sample of adult men was found to be r = 0.868. Assuming both associations are linear, which association—the association between height and armspan for
If there is a positive correlation between number of years studying math and shoe size (for children), does that prove that larger shoes cause more studying of math, or vice versa? Can you think of a confounding variable that might be influencing both of the other variables?
Suppose that the growth rate of children looks like a straight line if the height of a child is observed at the ages of 24 months, 28 months, 32 months, and 36 months. If you use the regression obtained from these ages and predict the height of the child at 21 years, you might find that the
If the correlation between height and weight of a large group of people is 0.67, find the coefficient of determination (as a percent) and explain what it means. Assume that height is the predictor and weight is the response, and assume that the association between height and weight is linear.
Does a correlation of -0.70 or +0.50 give a larger coefficient of determination? We say that the linear relationship that has the larger coefficient of determination is more strongly correlated. Which of the values shows a stronger correlation?
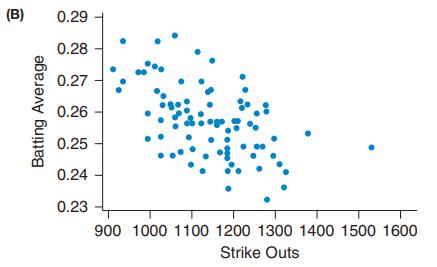
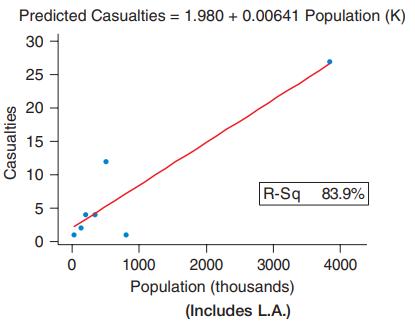
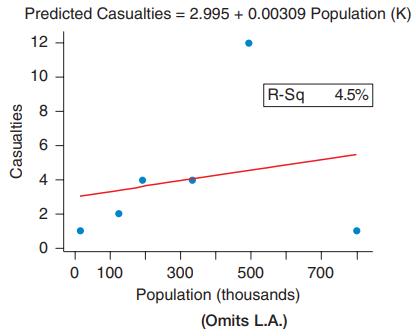
The figures show the number of Iraq casualties through October 2009 and the population of some hometowns from which the servicemen or servicewomen came, according to the Los Angeles Times. Comment on the difference in graphs and in the coefficient of determination between the top scatterplot that
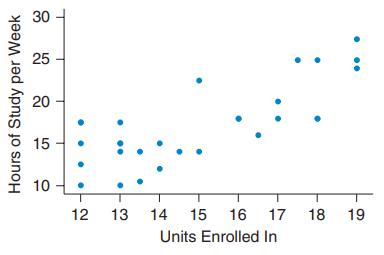
The figure shows the number of units that students were enrolled in and the number of hours (per week) that they reported studying. Do you think there is a positive trend, a negative trend, or no noticeable trend? Explain what this means about the students. 25 20 15 10 12 13 14 15 16 17 18 19
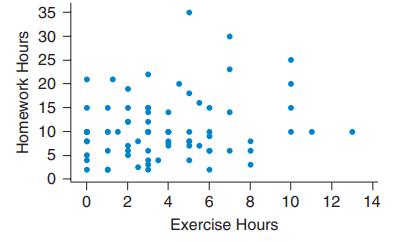
The scatterplot shows the number of hours of exercise per week and the number of hours of homework per week for some students. Explain what it shows. 35 30 25 20 15 10 5 0 2 4 6 8 10 12 14 Exercise Hours Homework Hours
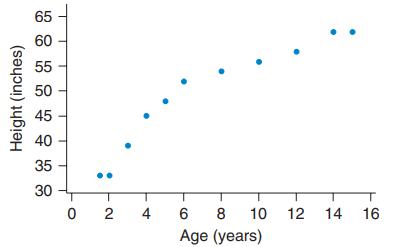
The figure shows information about the ages and heights of several children. Why would it not make sense to find the correlation or to perform linear regression with this data set? Explain. 65 60 55 50 45 40 35 30 0 2 4 6 8 10 12 14 16 Age (years) Height (inches)
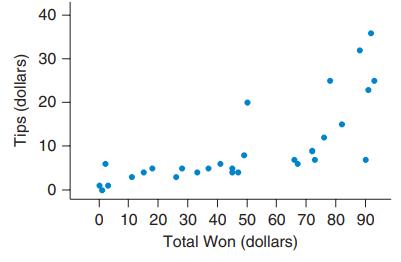
The figure shows the amount of money won by people playing blackjack and the amount of tips they gave to the dealer (who was a statistics student), in dollars. Would it make sense to find a correlation for this data set? Explain. 40 30 10 - O 10 20 30 40 50 60 7O 80 90 Total Won (dollars)
A doctor is studying cholesterol readings in his patients. After reviewing the cholesterol readings, he calls the patients with the highest cholesterol readings (the top 5% of readings in his office) and asks them to come back to discuss cholesterol-lowering methods. When he tests these patients a
Suppose that students who scored much lower than the mean on their first statistics test were given special tutoring in the subject. Suppose that they tended to show some improvement on the next test. Explain what might cause the rise in grades other than the tutoring program itself.
A Monopoly player claims that the probability of getting a 4 when rolling a six-sided die is 1/6 because the die is equally likely to land on any of the six sides. Is this an example of an empirical probability or a theoretical probability? Explain.
A magician claims that he has a fair coin—“fair” because both sides, heads and tails, are equally likely to land face up when the coin is flipped. He tells you that if you flip the coin three times, the probability of getting three tails is 1>8. Is this an empirical probability or a
Which of the following numbers could not be probabilities, and why? a. 5.63 b. 0.063 c. –0.063 d. 163% e. 1.63%
Suppose a person is selected at random from a large population. Label each pair of events as mutually exclusive or not mutually exclusive. a. The person is married; the person is single. b. The person plays professional baseball; the person is Latino.
Suppose a person is selected at random from a large population. Label each pair of events as mutually exclusive or not mutually exclusive. a. The person is a snowboarder; the person is a skier. b. The person is 5 years old; the person is a U.S. senator.
Assume that we are talking about all students at your college. a. Which group is larger: students who are currently taking English AND math, or students who are currently taking English? b. Which group is larger: students who are taking English OR math, or students who are taking English?
Considering all the adults in the United States, which group is larger: people who are married AND have a college degree, or people who are married OR have a college degree?
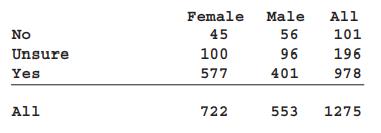
A person is selected randomly from the men in the group whose responses are summarized in the table. We want to find the probability that a male said Yes. Which of the following statements best describes the problem? i. P(Yes|Male)ii. P(Male|Yes)iii. P(Male AND Yes) Female Male All No 45 56
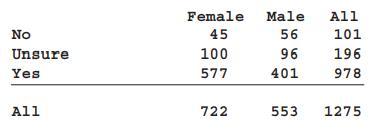
A person is selected randomly from the entire group whose responses are summarized in the table for Exercise 5.47. We want to find the probability that the person selected is a male who said yes. Which of the following statements best describes the problem? i. P(Yes|Male)ii. P(Male|Yes)iii.
Suppose a person is chosen at random. Use your understanding about the world of basketball to decide whether the event that the person is taller than six feet and the event that the person plays professional basketball are independent or associated. Explain.
About 12% of men and 10% of women are left-handed. If we select a person at random, are the event that the person is male and the event that the person is left-handed independent or associated?
Suppose a person is chosen at random. Use your knowledge about the world to decide whether the event that the person has brown eyes and the event that the person is female are independent or associated. Explain.
Ring sizes typically range from about 3 to about 14. Based on what you know about gender differences, if we randomly select a person, are the event that the ring size is smaller than 5 and the event that the person is a male independent or associated? Explain.
Assume a person is selected randomly from the group of people represented in the table in Exercise 5.47. The probability that the person says Yes given that the person is a woman is 577>722, or 79.9%. The probability that the person is a woman given that the person says Yes is 577>978, or
Roll a fair six-sided die five times, and record the number of spots on top. Which sequence is more likely? Explain. Sequence A: 66666 Sequence B: 16643
Assume that babies born are equally likely to be boys (B) or girls (G). Assume a woman has 6 children, none of whom are twins. Which sequence is more likely? Explain. Sequence A: GGGGGG Sequence B: GGGBBB
If you flip a fair coin repeatedly and the first four results are tails, are you more likely to get heads on the next flip, more likely to get tails again, or equally likely to get heads or tails?
ccording to a Pew poll conducted in 2012, 228 out of 380 Republicans viewed “Capitalism” as positive. If one Republican is randomly chosen from those 380, what is the probability that the person has a positive view of “Capitalism”?
According to a Pew poll conducted in 2012, 235 out of 489 Democrats viewed “Socialism” as positive. If one Democrat is randomly chosen from those 489, what is the probability that the person has a positive view of “Socialism”?
Women return to prison at a lower rate than men (58.0% for women, compared to 68.6% for men) in California. For a randomly chosen prisoner, are the event that the person returns to prison and the event that the person is male independent?
A certain professional basketball player typically makes 80% of his basket attempts, which is considered to be good. Suppose you go to several games at which this player plays. Sometimes the player attempts only a few baskets, say 10. Other times, he attempts about 60. On which of those nights is
About 17% of American men have blue eyes and 17% of American women have blue eyes. If we randomly select an American, are the event that the person has blue eyes and the event that the person is male independent?
Suppose a person is selected at random. Label each pair of events as mutually exclusive or not mutually exclusive. a. The person has brown eyes; the person has blue eyes. b. The person is 50 years old; the person is a U.S. senator.
Determine whether each of the following variables would best be modeled as continuous or discrete. a. Number of cars passing a certain patrolman during one working day b. Speed of a car (miles per hour) on a freeway
In 2009, the National Highway Traffic Safety Administration said that 84% of drivers buckled their seat belts. Assume that this percentage is still accurate. If four drivers are randomly selected, what is the probability that they are all wearing their seat belts?
Imagine rolling a red die and a blue die. From this trial, name a pair of independent events.
Imagine rolling a red die and a blue die. From this trial, name a pair of mutually exclusive events.
A Gallup poll from December of 2009 asked whether U.S. residents who are aware of climate change thought their government was doing enough to reduce emissions of cars and factories. Gallup estimated that 52% of all such U.S residents felt that the government was not doing enough. If another poll
Name two measures of the variation of a distribution, and state the conditions under which each measure is preferred for measuring the variability of a single data set.
Suppose you have a data set with the weights of all members of a high school soccer team and all members of a high school academic decathlon team (a team of students selected because they often answer quiz questions correctly). Which team do you think would have a larger standard deviation of
The mean birth length for U.S. children born at full term (after 40 weeks) is 52.2 cm (about 20.6 inches). Suppose the standard deviation is 2.5 cm and the distributions are unimodal and symmetric. a. What is the range of birth lengths (in centimeters) of U.S.-born children from one standard
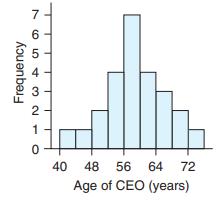
The histogram shows the ages of 25 CEOs listed at Forbes.com. Based on the distribution, what is the approximate mean age of the CEOs in this data set? Write a sentence in context (using words in the question) interpreting the estimated mean. The typical CEO is about ________ years old. 7 6 3
A real estate agent claims that all things being equal, houses with swimming pools tend to sell for less than those without swimming pools. What does this statement mean? a. There are fewer homes with swimming pools than without. b. The typical price for homes with pools is smaller than
A sociologist says, “Typically, men in the United States still earn more than women.” What does this statement mean? (Pick the best choice.) a. All men make more than all women in the United States. b. All U.S. women’s salaries are less varied than all men’s salaries. c. The
Create a dotplot that has at least 10 observations and does not have skew
Create a dotplot that has at least 10 observations and is rightskewed.
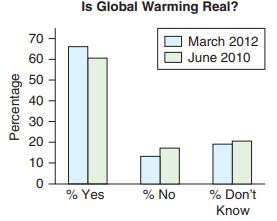
People were asked whether they thought global warming is happening. The graph shows the results of two surveys, one done in 2010 and the other done in 2012 (Leiserowitz et al.). Yes means they believe that global warming is happening and No means they do not believe that. What does the graph tell
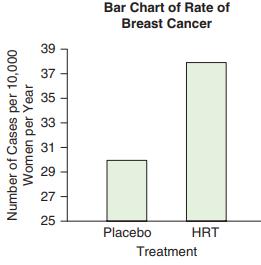
The bar chart shows a comparison of breast cancer rates for those who took HRT and those who took a placebo. Explain why the graph is deceptive, and indicate what could be done to make it less so. Bar Chart of Rate of Breast Cancer 39 37 35 33 31 29 27 25 Placebo HRT Treatment Number of Cases
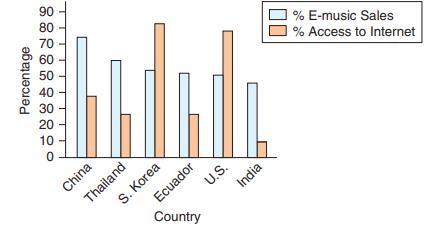
The bar graph shows information reported in Time magazine (May 28, 2012). For each country, the percentage of music sold over the Internet and the percentage of people with access to the Internet are displayed. a. Which two countries have the largest percentage with access to the
he table shows the first few entries for the number of hours of television viewed per week for some fifth grade students, stacked and coded, where 1 represents a girl and 0 represents a boy. What would be appropriate graphs to compare the distributions of hours of TV watched per week for boys
The table gives information on the top five countries from which U.S. residents adopted children in 2007. Sketch an appropriate graph of the distribution, and comment on its important
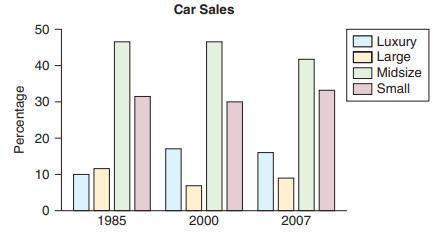
With gas prices rising, as they did between 1985 and 2007, you might expect people to move toward buying smaller cars. Compare the types of cars sold in 1985, 2000, and 2007 as shown in the figure. a. Which type of car sold the most in all three years? b. What is the trend for small cars?
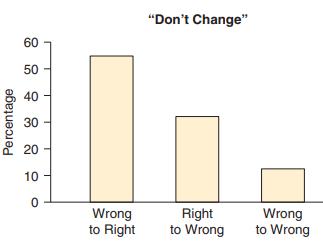
One of the authors wanted to determine the effect of changing answers on multiple-choice tests. She studied the tests given by another professor, who had told his students before their exams that if they had doubts about an answer they had written, they would be better off not changing their
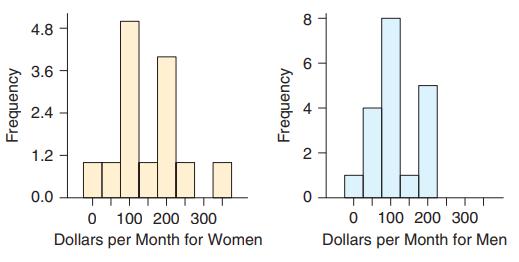
The histograms show the distribution of the estimated numbers of dollars per month spent on clothes for college women (left) and college men (right). a. Compare and describe the shape of the distributions. b. Which group tends to spend more? c. Which group has more variation in its
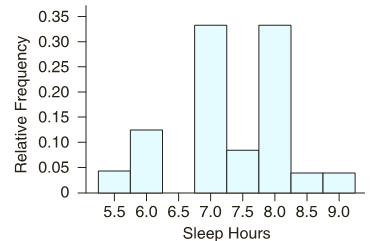
From the histogram shown in Exercise 2.4, what is the typical number of sleep hours for these men? Data From Exercise 2.4The relative frequency histogram shows the number of hours of sleep (Sleep Hours) reported as experienced “last night” for 24 men in college.a. About how many men had 6
The distribution of in-state annual tuition for all colleges and universities in the United States is bimodal. What is one possible reason for this bimodality?
According to the ancient Roman architect Vitruvius, a person’s armspan (the distance from fingertip to fingertip with the arms stretched wide) is approximately equal to his or her height. For example, people 5 feet tall tend to have an armspan of 5 feet. Explain, then, why the distribution of
Predict the shape of the distribution of the numbers of times a group of 500 people eat breakfast in one week.
A teacher asks 90 students who drive how many speeding tickets they received in the last year. Predict the shape of the distribution and explain.
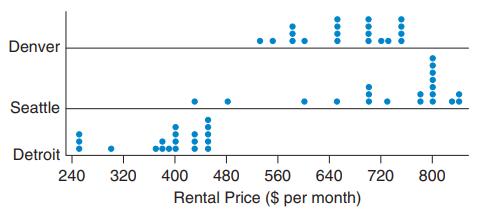
The dotplot shows rental prices per month for condos listed in three cities. The prices were obtained from Zillow.com. a. Center: Which city typically has the lowest rents? b. Spread: Which city has the greatest spread? c. Shape: What is the direction of skew for the distribution of
The relative frequency histogram shows the number of hours of sleep (Sleep Hours) reported as experienced “last night” for 24 men in college.a. About how many men had 6 or fewer hours of sleep? b. The graph is bimodal. What are the two modes? 0.35 0.30 0.25 0.20 0.15 0.10
As part of a study, sixteen young men performed high-intensity exercise that totaled only 15 minutes in a two-week period. At the end of two weeks, several (but not all) tests for diabetes, such as an insulin sensitivity test, showed improvement. Do these results indicate that brief, highintensity
A study conducted by Lewis et al. in 1986 looked at 14 juveniles awaiting execution. They found that 57% (8 of the 14) had had a serious brain injury. Can we conclude that head trauma causes bad behavior later in life? What primary factor is not present here that should be present in both
The September 2011 issue of the Berkeley Wellness Letter said that coffee reduces the chance of prostate cancer. A study of 48,000 male health care professionals showed that those consuming the most coffee (six or more cups per day) had a 60% reduced risk of developing advanced prostate cancer.
The Harvard Health Letter (June 2012) suggested that overeating reduces brain function. Is this likely to be a conclusion from observational studies or randomized experiments? Can we conclude that overeating causes a reduction in brain function? Why or why not?
Posted at the Mayo Clinic’s website was information on the use of vitamin C for breast-feeding mothers. The children whose mothers had chosen to take high doses of vitamin C had a 30% lower risk of developing allergies. Can you conclude that the use of vitamin C caused the reduction in allergies?
In the fall of 2004, there was a shortage in flu vaccine in the United States after it was discovered that vaccines from one of the manufacturers were contaminated. The New England Journal of Medicine reported on a study that was done to see whether a smaller dose of the vaccine could be used
A researcher was interested in the effect of exercise on memory. She randomly assigned half of a group of students to run up a stairway three times and the other half to rest for an equivalent amount of time. Each student was then asked to memorize a series of random digits. She compared the
A researcher was interested in the effect of exercise on academic performance in elementary school children. She went to the recess area of an elementary school and identified some students who were exercising vigorously and some who were not. The researcher then compared the grades of the
A local public school encourages, but does not require, students to wear uniforms. The principal of the school compares the grade point averages of students at this school who wear uniforms with the GPAs of those who do not wear uniforms to determine whether those wearing uniforms tend to have
A group of boys is randomly divided into two groups. One group watches violent cartoons for one hour, and the other group watches cartoons without violence for one hour. The boys are then observed to see how many violent actions they take in the next two hours, and the two groups are compared.
Patients with Alzheimer’s disease are randomly divided into two groups. One group is given a new drug, and the other is given a placebo. After six months they are given a memory test to see whether the new drug fights Alzheimer’s better than a placebo.
A researcher is interested in the effect of music on memory. She randomly divides a group of students into three groups: those who will listen to quiet music, those who will listen to loud music, and those who will not listen to music. After the appropriate music is played (or not played), she
Records of patients who have had broken ankles are examined to see whether those who had physical therapy achieved more ankle mobility than those who did not.
A student watched picnickers with a large cooler of soft drinks to see whether teenagers were less likely than adults to choose diet soft drinks over regular soft drinks.
In 2008, the National Highway Traffic Safety Administration reported that the number of pedestrian fatalities in Miami-Dade County, Florida, was 65 and that the number in Hillsborough County, Florida, was 45. Can we conclude that pedestrians are safer in Hillsborough County? Why or why not?
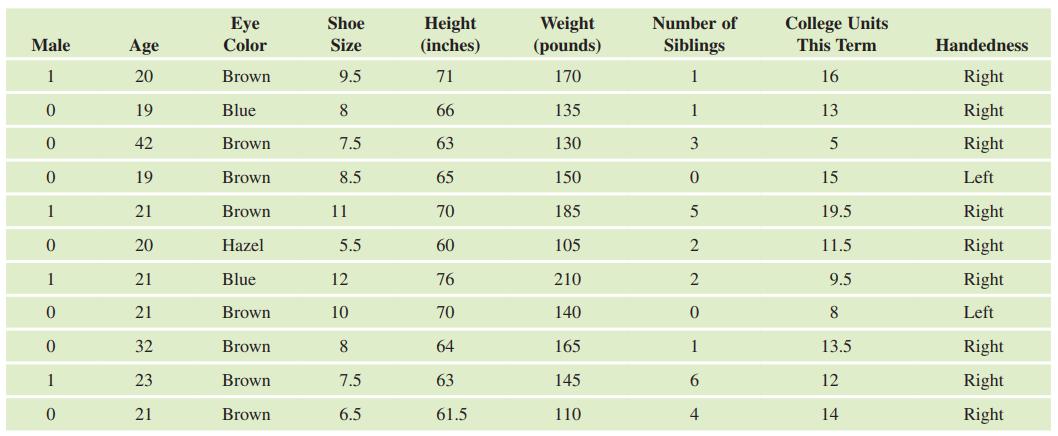
Find the frequency, proportion, and percentage of right-handed people in Table 1A on page 27. Table 1A on page 27. The data in Table 1A were collected from one of the authors’ statistics classes. The column heads give the variable, and each of the other rows represents a student in the
Find the frequency, proportion, and percentage of women in Table 1A on page 27. Table 1A on page 27. The data in Table 1A were collected from one of the authors’ statistics classes. The column heads give the variable, and each of the other rows represents a student in the class.
Showing 100 - 200
of 365
1
2
3
4
Step by Step Answers