New Semester
Started
Get
50% OFF
Study Help!
--h --m --s
Claim Now
Question Answers
Textbooks
Find textbooks, questions and answers
Oops, something went wrong!
Change your search query and then try again
S
Books
FREE
Study Help
Expert Questions
Accounting
General Management
Mathematics
Finance
Organizational Behaviour
Law
Physics
Operating System
Management Leadership
Sociology
Programming
Marketing
Database
Computer Network
Economics
Textbooks Solutions
Accounting
Managerial Accounting
Management Leadership
Cost Accounting
Statistics
Business Law
Corporate Finance
Finance
Economics
Auditing
Tutors
Online Tutors
Find a Tutor
Hire a Tutor
Become a Tutor
AI Tutor
AI Study Planner
NEW
Sell Books
Search
Search
Sign In
Register
study help
mathematics
statistics the art and science
Statistics Unlocking The Power Of Data 1st Edition Robin H. Lock, Patti Frazer Lock, Kari Lock Morgan, Eric F. Lock, Dennis F. Lock - Solutions
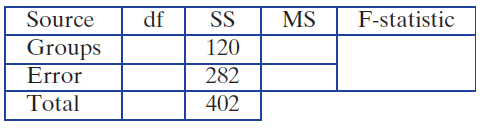
We give sample sizes for the groups in a dataset and an outline of an analysis of variance table with some information on the sums of squares. Fill in the missing parts of the table. What is the value of the F-test statistic?Three groups with n1 = 5, n2 = 5, and n3 = 5. ANOVA table includes: df
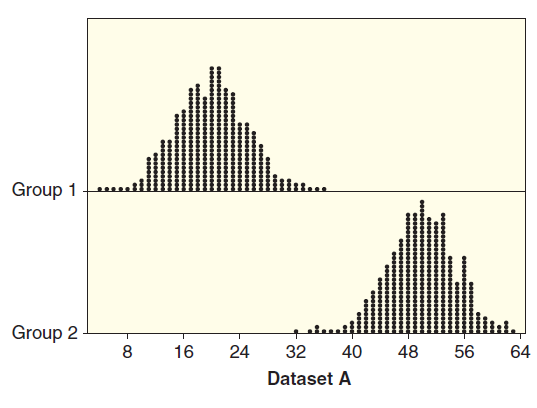
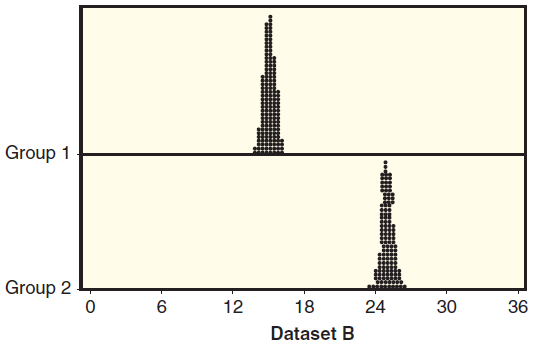
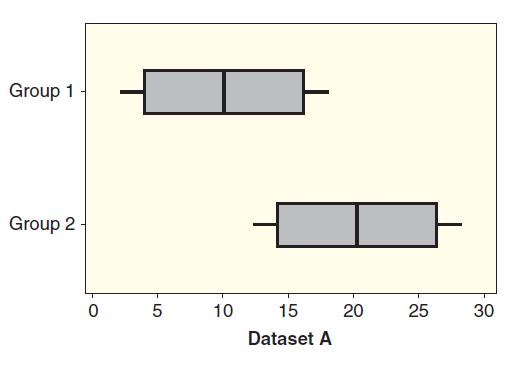
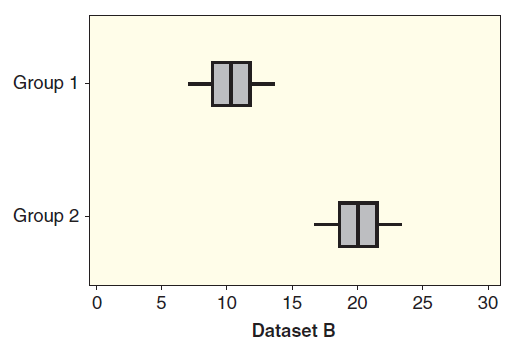
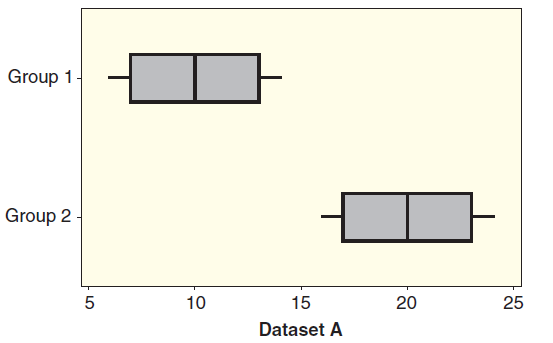
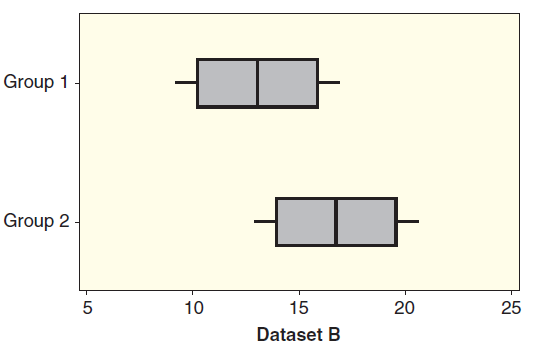
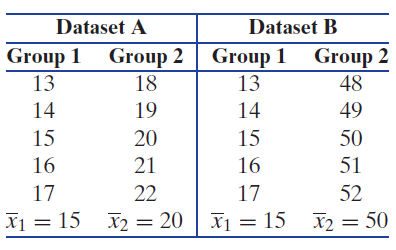
Two sets of sample data, A and B, are given. Without doing any calculations, indicate in which set of sample data, A or B, there is likely to be stronger evidence of a difference in the two population means. Give a brief reason, comparing means and variability, for your answer. Group 1 Group 2 16
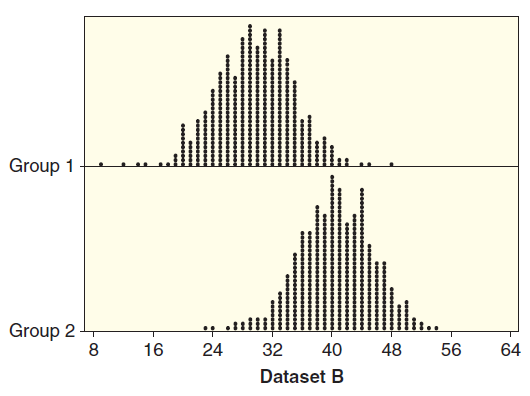
Two sets of sample data, A and B, are given. Without doing any calculations, indicate in which set of sample data, A or B, there is likely to be stronger evidence of a difference in the two population means. Give a brief reason, comparing means and variability, for your answer. Group 1 Group 2 36
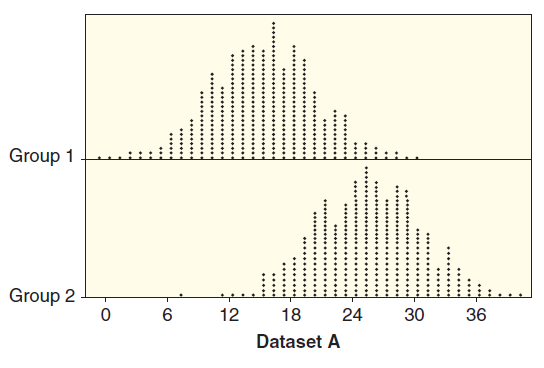
Two sets of sample data, A and B, are given. Without doing any calculations, indicate in which set of sample data, A or B, there is likely to be stronger evidence of a difference in the two population means. Give a brief reason, comparing means and variability, for your answer. Group 1 Group 2 20
Two sets of sample data, A and B, are given. Without doing any calculations, indicate in which set of sample data, A or B, there is likely to be stronger evidence of a difference in the two population means. Give a brief reason, comparing means and variability, for your answer. Group 1 Group 2 10
Two sets of sample data, A and B, are given. Without doing any calculations, indicate in which set of sample data, A or B, there is likely to be stronger evidence of a difference in the two population means. Give a brief reason, comparing means and variability, for your answer. Dataset A Dataset B
In another study to investigate the effect of women’s tears on men, 16 men watch an erotic movie and then half sniff women’s tears and half sniff a salt solution while brain activity is monitored.A data collection method is described to investigate a difference in means. In each case, determine
To study the effect of women’s tears on men, levels of testosterone are measured in 50 men after they sniff women’s tears and after they sniff a salt solution. The order of the two treatments was randomized and the study was double-blind.A data collection method is described to investigate a
Data 2.11 on page 111 introduces the dataset NutritionStudy which contains, among other things, information about smoking history and gender of the participants. Is there a significant association between these two variables? Use a statistical software package and the variables PriorSmoke and
Data 2.11 on page 111 introduces the dataset NutritionStudy which contains, among other things, information about vitamin use and gender of the participants. Is there a significant association between these two variables? Use a statistical software package and the variables VitaminUse and Gender to
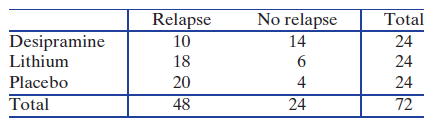
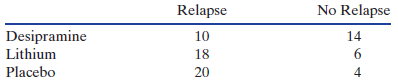
Exercise 7.41 on page 485 describes an experiment on helping cocaine addicts break the cocaine addiction, in which cocaine addicts were randomized to take desipramine, lithium, or a placebo. The results (relapse or no relapse after six weeks) are summarized in Table 7.35.Table 7.35(a) In Exercise
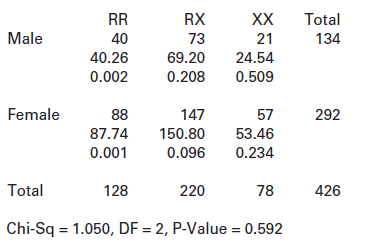
We see in the previous two exercises that sprinters are more likely to have allele R and genotype RR versions of the ACTN3 gene, which makes these versions associated with fast-twitch muscles. Is there an association between genotype and gender? Computer output is shown for this chi-square test,
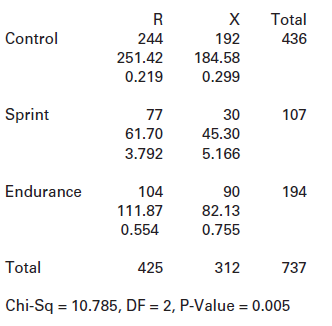
The study on genetics and fast-twitch muscles includes a sample of elite sprinters, a sample of elite endurance athletes, and a control group of nonathletes. Is there an association between genetic allele classification (R or X) and group (sprinter, endurance, control)? Computer output is shown for
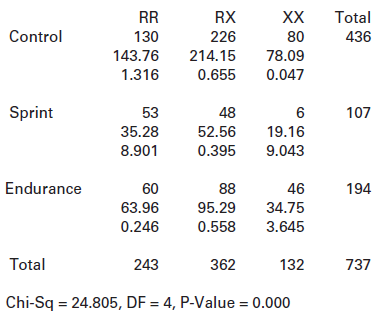
The study on genetics and fast-twitch muscles includes a sample of elite sprinters, a sample of elite endurance athletes, and a control group of nonathletes. Is there an association between genotype classification (RR, RX, or XX) and group (sprinter, endurance, control group)? Computer output is
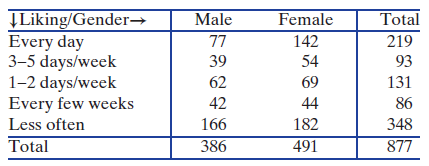
Exercise 7.45 introduced a 2010 study about users of social networking sites such as Facebook. Table 7.34 shows the frequency of users €˜€˜liking€ content on Facebook, with the data shown by gender. Does the frequency of €˜€˜liking€
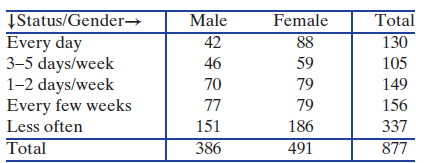
Exercise 7.45 introduced a 2010 study about users of social networking sites such as Facebook. Table 7.33 shows the self-reported frequency of status updates on Facebook by gender. Are frequency of status updates and gender related? Show all details of the test.Table 7.33Exercise 7.45The Pew
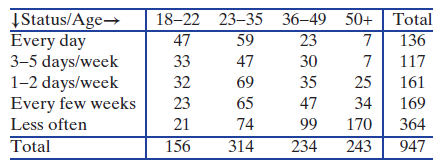
Exercise 7.45 introduced a 2010 study about users of social networking sites such as Facebook. Table 7.32 shows the self-reported frequency of status updates on Facebook by age groups.Table 7.32(a) Based on the totals, if age and frequency of status updates are really unrelated, how many of the 156
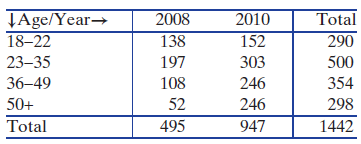
The Pew Research Center conducted a survey of randomly sampled American adults in 2008 and in 2010, asking them about their use of social networking sites such as Facebook. Table 7.31 shows age groups of social networking site users in 2008 and in 2010. Did the age distribution change significantly
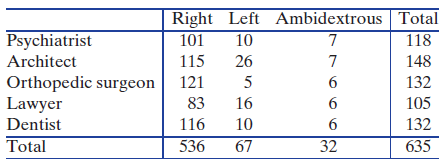
Is the career someone chooses associated with being left- or right-handed? In one study a sample of Americans from a variety of professions were asked if they consider themselves left-handed, right-handed, or ambidextrous (equally skilled with the left and right hand). The results for five
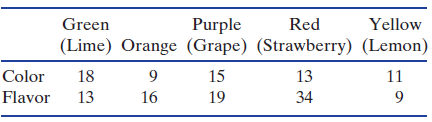
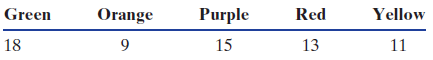
Exercise 7.13 on page 472 discusses a sample of people choosing their favorite Skittles flavor by color (green, orange, purple, red, or yellow). A separate poll sampled 91 people, again asking them their favorite skittle flavor, but rather than by color they asked by the actual flavor (lime,
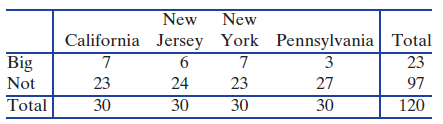
Throughout Unit C we examined various relationships between the variables regarding houses for sale in the dataset HomesFor- Sale. One topic of repeated interest was differences between states. We previously only had the capability to test for a difference between two states at a time, but we can
Cocaine addiction is very hard to break. Even among addicts trying hard to break the addiction, relapse is common. (A relapse is when a person trying to break out of the addiction fails and uses cocaine again.) Data 4.7 on page 267 introduces a study investigating the effectiveness of two drugs,
In Exercise 6.178 on page 403 we perform a test for the difference in the proportion of penguins who survive over a 10-year period, between penguins tagged with metal tags and those tagged with electronic tags. We are interested in testing whether the type of tag has an effect on penguin survival
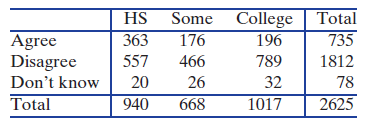
In Data 2.1 on page 46, we introduce a study in which people were asked whether they agreed or disagreed with the statement that there is only one true love for each person. Table 7.27 gives a two-way table showing the answers to this question as well as the education level of the respondents. A
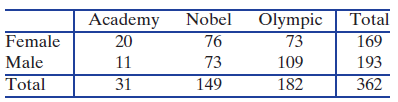
Example 2.6 on page 51 contains a two-way table showing preferences for an award (Academy Award, Nobel Prize, Olympic gold medal) by gender for the students sampled in StudentSurvey. The data are reproduced in Table 7.26. Test whether the data indicate there is some association between gender and
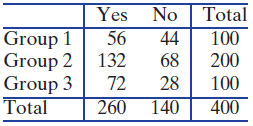
Two-way table in Exercise 7.30(Group 3, Yes) cellRefer to the tables in Skill Builder 1. In each case, give the degrees of freedom for the chi-square test based on that two-way table. Yes No Total 56 44 Group 1 Group 2 132 Group 3 72 260 100 68 200 28 100 140 Total 400
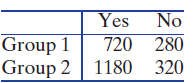
Give a two-way table and specify a particular cell for that table. In each case find the expected count for that cell and the contribution to the chi-square statistic for that cell.(Group 2, No) cell No 720 280 Group 2| 1180 320 Yes Group 1
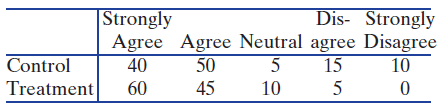
Give a two-way table and specify a particular cell for that table. In each case find the expected count for that cell and the contribution to the chi-square statistic for that cell.(Control, Disagree) cell Dis- Strongly Agree Agree Neutral agree Disagree 10 Strongly Control Treatment 40 15 50 45 5
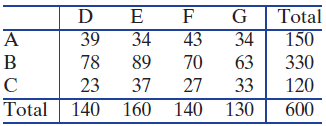
Give a two-way table and specify a particular cell for that table. In each case find the expected count for that cell and the contribution to the chi-square statistic for that cell.(B, E) cell Total D 39 89 G 43 63 34 34 150 330 78 37 70 33 |C Total 27 140 160 140 130 23 120 600
Give a two-way table and specify a particular cell for that table. In each case find the expected count for that cell and the contribution to the chi-square statistic for that cell.(Group 3, Yes) cell Yes No Total 56 44 Group 1 Group 2 132 Group 3 72 260 100 68 200 28 100 140 Total 400
Refer to the data in Digits that are described in Exercise 7.28. The 150 students were also asked to give the last two digits of their nine-digit social security number. Those digits are stored in SSN8 and SSN9 in the same file. Does the government do a better job at assigning numbers at random?
How well can people generate random numbers? A sample of students were asked to write down a ‘‘random” four-digit number. Responses from 150 students are stored in the file Digits. The data file has separate variables (RND1, RND2, RND3, and RND4) containing the digits in each of the four
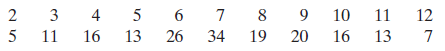
The game of craps is a gambling game where players place wagers on the sum from the roll of two six-sided dice. One author rolled a pair of dice 180 times and recorded the results in Table 7.18. He was attempting to make some numbers appear more often than they would by random chance. Use the 180
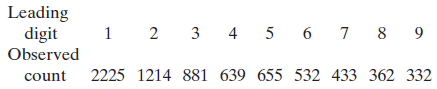
Refer to the discussion of Benford€™s law in Exercise 7.25. While this may seem like a curious oddity, researchers have developed some important applications for these proportions. One involves auditing company records to look for instances of fraud or other financial malfeasance. In many
Frank Benford, a physicist working in the 1930s, discovered an interesting fact about some sets of numbers. While you might expect the first digits of numbers such as street addresses or checkbook entries to be randomly distributed, Benford showed that in many cases the distribution of leading
Exercise 7.23 discusses a study investigating the ACTN3 genotypes RR, RX, and XX. The same study also examines the ACTN3 genetic alleles R and X, also associated with fast-twitch muscles. Of the 436 people in this sample, 244 were classified R and 192 were classified X. Does the sample provide
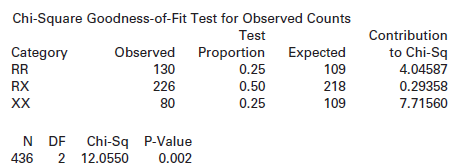
Chisquare tests are common in genetics. A gene called ACTN3 encodes a protein which functions in fasttwitch muscles. People have different variants of this gene, classified as RR, RX, or XX. Computer output is shown for testing whether the proportions in these categories are 0.25, 0.50, and 0.25,
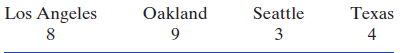
Major League Baseball is split into six divisions, one of which is the American League West. While specific teams in each division change often, the four teams currently in the AL West have been present since 1977 (Los Angeles/California Angels, Oakland A€™s, Seattle Mariners, and Texas
Movies based on Ian Fleming’s novels starring British secret agent James Bond have become one of the longest running film series to date. Over the course of the series, six different actors have portrayed the secret agent. Which actor is the best James Bond? A sample of responses to this question
A new study indicates that elderly people are able to postpone death for a short time to reach an important occasion. The researchers studied deaths from natural causes among 1200 elderly people of Chinese descent in California during six months before and after the Harbor Moon Festival.
Assume you are working as a statistician for the automotive company Ford. Ford’s three most popular cars are the Escape (SUV), the Focus (midsize sedan), and the Fusion (hybrid sedan). Your boss is putting together next year’s production numbers and asks you to determine if any of the three
Most medical school graduates in the US enter their residency programs at teaching hospitals in July. A recent study suggests that a spike in deaths due to medication errors coincides with this influx of new practitioners. The study indicates that the number of deaths is significantly higher than
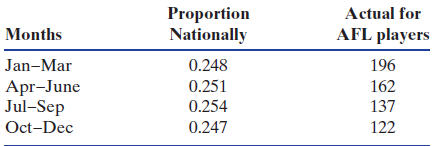
Most Australian youth-sports leagues separate athletes by birthdate, and the cutoff date is January 1st. Thus, those children born in January and February have some physical advantages in youth sports over those born in November and December. A recent study suggests that those physical advantages
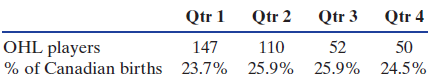
In his book Outliers: The Story of Success (2008), Malcolm Gladwell speculates that Canadian ice hockey players that are born early in the year have an advantage. This is because the birthdate cutoff for different levels of youth hockey leagues in Canada is January 1st, so youth hockey players who
As recently as 2008, 70% of users of social networking sites such as Facebook were 35 years old or younger. Now the age distribution is much more spread out. Table 7.10 shows the age distribution of 975 users of social networking sites from a survey reported in June 2011.Table 7.10(a) Test an
In Data 6.1 on page 367 we see a table, reproduced in Table 7.9, that shows the choices made by 119 players on the first turn of a Rock-Paper-Scissors game. Recall that rock beats scissors which beats paper which beats rock. A player gains an advantage in playing this game if there is evidence that
Skittles are a popular fruity candy with five different flavors (colored green, orange, purple, red, and yellow). A sample of 66 people recorded their favorite flavor and the results are shown in Table 7.8. Perform a chi-square test, as indicated in the steps below, to see whether or not the
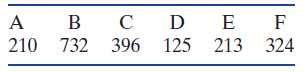
Give a null hypothesis for a goodness-of-fit test and a frequency table from a sample. For each table, find:(a) The expected count for the category labeled B(b) The contribution to the sum of the chi-square statistic for the category labeled B(c) The degrees of freedom for the chi-square
Give a null hypothesis for a goodness-of-fit test and a frequency table from a sample. For each table, find:(a) The expected count for the category labeled B(b) The contribution to the sum of the chi-square statistic for the category labeled B(c) The degrees of freedom for the chi-square
Give a null hypothesis for a goodness-of-fit test and a frequency table from a sample. For each table, find:(a) The expected count for the category labeled B(b) The contribution to the sum of the chi-square statistic for the category labeled B(c) The degrees of freedom for the chi-square
Give a null hypothesis for a goodness-of-fit test and a frequency table from a sample. For each table, find:(a) The expected count for the category labeled B(b) The contribution to the sum of the chi-square statistic for the category labeled B(c) The degrees of freedom for the chi-square
The categories of a categorical variable are given along with the observed counts from a sample. The expected counts from a null hypothesis are given in parentheses. Compute the χ2-test statistic, and use the χ2-distribution to find the p-value of the test. Category Observed B
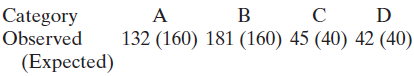
The categories of a categorical variable are given along with the observed counts from a sample. The expected counts from a null hypothesis are given in parentheses. Compute the χ2-test statistic, and use the χ2-distribution to find the p-value of the test. A B C D 132 (160)
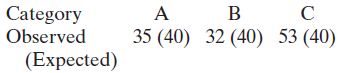
The categories of a categorical variable are given along with the observed counts from a sample. The expected counts from a null hypothesis are given in parentheses. Compute the χ2-test statistic, and use the χ2-distribution to find the p-value of the test. в с Category A B
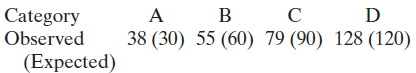
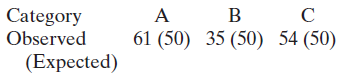
The categories of a categorical variable are given along with the observed counts from a sample. The expected counts from a null hypothesis are given in parentheses. Compute the χ2-test statistic, and use the χ2-distribution to find the p-value of the test. Category Observed A
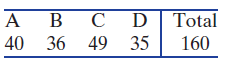
Find the expected counts in each category using the given sample size and null hypothesis.H0: p1 = 0.7, p2 = 0.1, p3 = 0.1, p4 = 0.1; n = 400
Find the expected counts in each category using the given sample size and null hypothesis.H0: pA = 0.50, pB = 0.25, pC = 0.25; n = 200
Find the expected counts in each category using the given sample size and null hypothesis.H0 All three categories A, B, C are equally likely; n = 1200
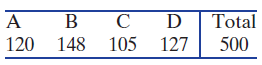
Find the expected counts in each category using the given sample size and null hypothesis.H0: p1 = p2 = p3 = p4 = 0.25; n = 500
To study the effect of sitting with a laptop computer on one’s lap on scrotal temperature, 29 men have their scrotal temperature tested before and then after sitting with a laptop for one hour.A data collection method is described to investigate a difference in means. In each case, determine
Test H0: μA = μB vs Ha: μA ≠ μB using the fact that Group A has 8 cases with a mean of 125 and a standard deviation of 18 while Group B has 15 cases with a mean of 118 and a standard deviation of 14.Use the t-distribution and the given sample results to complete the test of the given
Test H0: μT = μC vs Ha: μT < μC using the fact that the treatment group (T) has a sample mean of 8.6 with a standard deviation of 4.1 while the control group (C) has a sample mean of 11.2 with a standard deviation of 3.4. Both groups have 25 cases.Use the t-distribution and the given sample
Do left-handed or right-handed people make more money? One study recorded the hourly earnings for a random sample of 2295 American men, of whom 2027 were right-handed and 268 were left-handed. The righthanded men earned an average of $13.10 per hour, while the left-handed men earned an average of
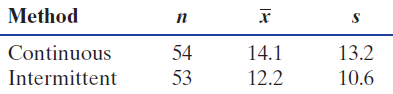
Researchers randomly assigned 107 young over weight women to cut 25% of their calories in one of two ways: The continuous group ate about 1500 calories a day every day while the intermittent group ate about 500 calories a day for two days a week and their typical diets the rest of the week.
In 2007 a Harvard psychologist set out to test her theory that ‘‘Mind-Set Matters.” She recruited 75 female maids working in different hotels to participate in her study, and informed 41 maids (randomly chosen) that the work they do satisfies the Surgeon General’s recommendations for an
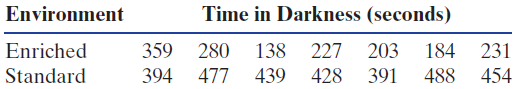
Many studies have shown that people who engage in any exercise have improved mental health over those that never exercise. In particular, even a small amount of exercise seems to confer some resilience to stress. Most of these studies, by necessity, have been observational studies. A recent
Studies are finding that bacteria in the stomach are essential for healthy functioning of the human body. One study68 compared the number of unique bacterial genes in stomachs of healthy patients and those of patients with irritable bowel syndrome (IBS). For healthy patients, we have x = 564
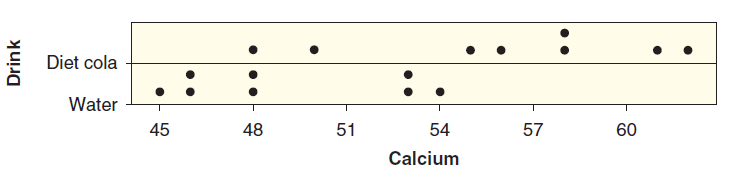
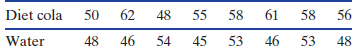
Exercise B.5 on page 305 introduces a study examining the effect of diet cola consumption on calcium levels in women. A sample of 16 healthy women aged 18 to 40 were randomly assigned to drink 24 ounces of either diet cola or water. Their urine was collected for three hours after ingestion of the
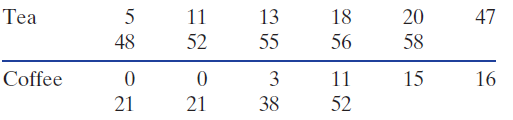
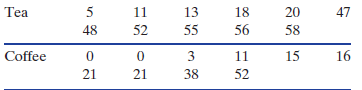
Drinking tea appears to offer a strong boost to the immune system. In a study introduced in Exercise 3.82 on page 203, we see that production of interferon gamma, a molecule that fights bacteria, viruses, and tumors, appears to be enhanced in tea drinkers. In the study, eleven healthy
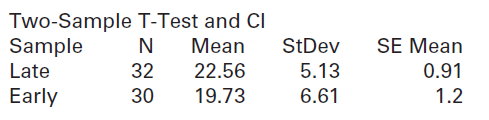
Data 1.3 on page 10 discusses a study designed to test whether applying a metal tag is detrimental to a penguin, as opposed to applying an electronic tag. One variable examined is the length of foraging trips. Longer foraging trips can jeopardize both breeding success and survival of chicks waiting
Data 1.3 on page 10 discusses a study designed to test whether applying a metal tag is detrimental to a penguin, as opposed to applying an electronic tag. One variable examined is the date penguins arrive at the breeding site, with later arrivals hurting breeding success. Arrival date is measured
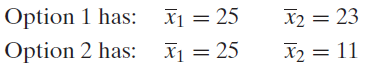
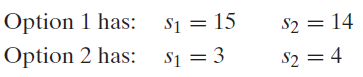
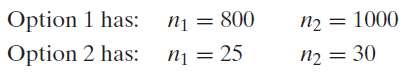
In each case below, two sets of data are given for a two-tail difference in means test. In each case, which version gives a smaller p-value relative to the other?(a) Both options have the same standard deviations and same sample sizes but: (b) Both options have the same means
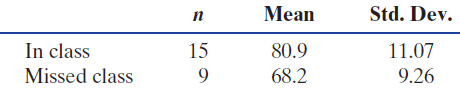
A statistics professor was handing out midterm grade slips on a Friday which happened to be the day before the school€™s Spring break. He noticed that there were an unusually large number of students missing from class that day. So he collected the leftover grade slips and created the
A young statistics professor decided to give a quiz in class every week. He was not sure if the quiz should occur at the beginning of class when the students are fresh or at the end of class when they€™ve gotten warmed up with some statistical thinking. Since he was teaching two sections
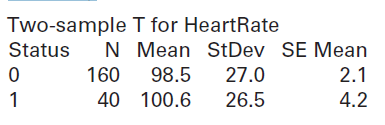
The dataset ICU-Admissions contains information on a sample of 200 patients being admitted to the Intensive Care Unit (ICU) at a hospital. One of the variables is HeartRate and another is Status which indicates whether the patient lived (Status = 0) or died (Status = 1). Use the computer output to
Use technology and the StudentSurvey dataset to test whether the data provide evidence that there is a difference in the mean number of hours of exercise per week between males and females. What are the hypotheses? What is the p-value given by the software? State the conclusion in context.
Use technology and the StudentSurvey dataset to test whether the data provide evidence that there is a difference in the mean number of hours spent watching television per week between males and females. What are the hypotheses? What is the p-value given by the software? State the conclusion in
The data in CommuteAtlanta (see Data 3.3 on page 193 for more description) contain a variable that identifies the sex of each commuter in the Atlanta sample. Test at a 5% level whether there is a difference in mean commute time between female and male commuters in Atlanta.Data 3.3 on age 193What is
A 95% confidence interval for μ1 − μ2 using the paired difference sample results x̅d = 3.7, sd = 2.1, nd = 30Use a t-distribution to find a confidence interval for the difference in means μ1 − μ2 using the relevant sample results from paired data. Give the best estimate for μ1 − μ2,
A 90% confidence interval for μ1 − μ2 using the paired difference sample results x̅d = 556.9, sd = 143.6, nd = 100Use a t-distribution to find a confidence interval for the difference in means μ1 − μ2 using the relevant sample results from paired data. Give the best estimate for μ1 −
A 99% confidence interval for μ1ˆ’ μ2using the paired data in the following table:Use a t-distribution to find a confidence interval for the difference in means μ1 ˆ’ μ2 using the relevant sample results from paired data.
A 95% confidence interval for μ1ˆ’ μ2using the paired data in the following table:Use a t-distribution to find a confidence interval for the difference in means μ1 ˆ’ μ2 using the relevant sample results from paired data.
Test H0: μ1 = μ2 vs Ha: μ1 ≠ μ2 using the paired difference sample results x̅d = 15.7, sd = 12.2, nd = 25.Use a t-distribution and the given matched pair sample results to complete the test of the given hypotheses. Assume the results come from random samples, and if the sample sizes are
Test H0: μ1 = μ2 vs Ha: μ1 ≠ μ2 using the paired difference sample results x̅d = −2.6, sd = 4.1, nd = 18.Use a t-distribution and the given matched pair sample results to complete the test of the given hypotheses. Assume the results come from random samples, and if the sample sizes are
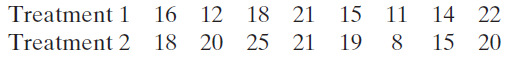
Test H0: μ1= μ2vs Ha: μ1< μ2using the paired data in the following table:Use a t-distribution and the given matched pair sample results to complete the test of the given hypotheses. Assume the results come from random samples, and if the
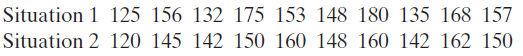
Test H0: μ1= μ2vs Ha: μ1> μ2using the paired data in the following table:Use a t-distribution and the given matched pair sample results to complete the test of the given hypotheses. Assume the results come from random samples, and if the
In a study to determine whether the color red increases how attractive men find women, one group of men rate the attractiveness of a woman after seeing her picture on a red background and another group of men rate the same woman after seeing her picture on a white background.A data collection
A study investigating the effect of exercise on brain activity recruits sets of identical twins in middle age, in which one twin is randomly assigned to engage in regular exercise and the other doesn’t exercise.A data collection method is described to investigate a difference in means. In each
We saw in Exercise 6.260 on page 425 that drinking tea appears to offer a strong boost to the immune system. In a study extending the results of the study described in that exercise, blood samples were taken on five participants before and after one week of drinking about five cups of tea a day
Exercise 4.86 on page 263 introduces a matched pairs study in which 47 participants had cell phones put on their ears and then had their brain glucose metabolism (a measure of brain activity) measured under two conditions: with one cell phone turned on for 50 minutes (the ‘‘on” condition) and
Exercise 6.284 describes a study to examine the effects of tea on the immune system. Use the information there to test whether mean production of interferon gamma as a response to bacteria is significantly higher after drinking tea than before drinking tea. Use a 5% significance level.Data from
Exercise 6.285 describes a matched pairs study examining the effect of cell phones on brain glucose metabolism. Use the information there to test to see if there is evidence that mean glucose metabolism is higher when a cell phone is nearby. Show all details of the test.Exercise 4.86 on page
On page 11 in Section 1.1, we describe studies to investigate whether there is evidence of pheromones (subconscious chemical signals) in female tears that affect sexual arousal in men. In one of the studies, 50 men had a pad attached to the upper lip that contained either female tears or a salt
Exercise 6.288 describes a study to measure, in a doubleblind randomized experiment, the effect of female tears on male testosterone. Use the information there to find a 99% confidence interval for the effect size (the amount of reduction in testosterone levels after sniffing female tears.)Exercise
Do you think your pulse rate is higher when you are taking a quiz than when you are sitting in a lecture? The data in Table 6.27 show pulse rates collected from 10 students in a class lecture and then from the same students during a quiz. The data are stored in QuizPulse10. Construct a 95%
Exercise 6.290 describes pulse rates collected from 10 students, once during a quiz and once during a lecture. The data are given in Table 6.27 and stored in QuizPulse10. We might expect mean pulse rates to increase under the stress of a quiz. Use the information in Exercise 6.290 and the data in
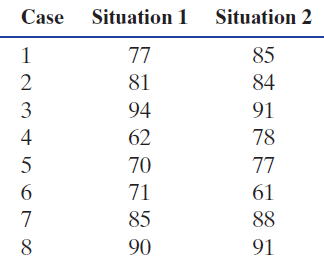
A story spoiler gives away the ending early. Does having a story spoiled in this way diminish suspense and hurt enjoyment? A study investigated this question. For 12 different short stories, the study€™s authors created a second version in which a spoiler paragraph at the beginning
Exercise 6.292 describes a study investigating whether giving away the ending of the story makes the story more or less enjoyable to read. The data are given in Table 6.28 and stored in StorySpoilers.(a) Explain why it is appropriate and helpful to use the matched pairs nature of these data in the
How big is the home field advantage in the National Football League (NFL)? In Exercise 6.240 on page 419, we examine a difference in means between home and away teams using two separate samples of 80 games from each group. However, many factors impact individual games, such as weather conditions
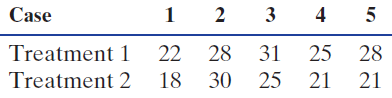
Table 6.29 gives a sample of grades on the first two quizzes in an introductory statistics course. We are interested in testing whether the mean grade on the second quiz is significantly higher than the mean grade on the first quiz.Table 6.29(a) Complete the test if we assume that the grades from
Showing 600 - 700
of 2108
1
2
3
4
5
6
7
8
9
10
11
12
13
14
15
Last
Step by Step Answers