New Semester
Started
Get
50% OFF
Study Help!
--h --m --s
Claim Now
Question Answers
Textbooks
Find textbooks, questions and answers
Oops, something went wrong!
Change your search query and then try again
S
Books
FREE
Study Help
Expert Questions
Accounting
General Management
Mathematics
Finance
Organizational Behaviour
Law
Physics
Operating System
Management Leadership
Sociology
Programming
Marketing
Database
Computer Network
Economics
Textbooks Solutions
Accounting
Managerial Accounting
Management Leadership
Cost Accounting
Statistics
Business Law
Corporate Finance
Finance
Economics
Auditing
Tutors
Online Tutors
Find a Tutor
Hire a Tutor
Become a Tutor
AI Tutor
AI Study Planner
NEW
Sell Books
Search
Search
Sign In
Register
study help
mathematics
statistics the art and science
Statistics Unlocking The Power Of Data 1st Edition Robin H. Lock, Patti Frazer Lock, Kari Lock Morgan, Eric F. Lock, Dennis F. Lock - Solutions
Are events A and B disjoint?Use the information that, for events A and B, we have P(A) = 0.4, P(B) = 0.3, and P(A and B) = 0.1.
Are events A and B independent?Use the information that, for events A and B, we have P(A) = 0.4, P(B) = 0.3, and P(A and B) = 0.1.
Find P(not A).Use the information that, for events A and B, we have P(A) = 0.8, P(B) = 0.4, and P(A and B) = 0.25.
We wish to find a model to predict levels of beta-carotene in the blood, which is the variable BetaPlasma in the dataset NutritionStudy, using the following variables as potential predictors: Age, Fat, Fiber, Alcohol, and BetaDiet. The last is the amount of beta-carotene consumed by a person.(a)
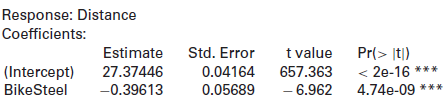
The commute is about 27 miles round trip, but actual biking distances, Distance, ranged from 25.86 to 27.52 miles. Output regressing Distance on BikeSteel is given below. Is the predicted distance higher for the carbon or the steel bike? By how much? Is this difference significant?Residual standard
Use the information that, for events A and B, we have P(A) = 0.8, P(B) = 0.4, and P(A and B) = 0.25.Find P(A or B).
Use the information that, for events A and B, we have P(A) = 0.8, P(B) = 0.4, and P(A and B) = 0.25.Find P(A if B).
Use the information that, for events A and B, we have P(A) = 0.8, P(B) = 0.4, and P(A and B) = 0.25.Find P(B if A).
Use the information that, for events A and B, we have P(A) = 0.8, P(B) = 0.4, and P(A and B) = 0.25.Are events A and B disjoint?
Use the information that, for events A and B, we have P(A) = 0.8, P(B) = 0.4, and P(A and B) = 0.25.Are events A and B independent?
Use the fact that we have independent events A and B with P(A) = 0.7 and P(B) = 0.6.Find P(A if B).
Use the fact that we have independent events A and B with P(A) = 0.7 and P(B) = 0.6.Find P(B if A).
Use the fact that we have independent events A and B with P(A) = 0.7 and P(B) = 0.6.Find P(A and B).
Use the fact that we have independent events A and B with P(A) = 0.7 and P(B) = 0.6.Find P(A or B).
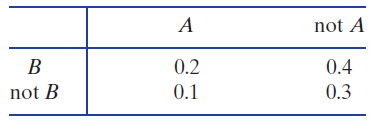
Table 11.3 gives probabilities for various combinations of events A, B, and their complements.Table 11.3Find P(A). not A 0.4 B 0.2 not B 0.1 0.3
Table 11.3 gives probabilities for various combinations of events A, B, and their complements.Table 11.3Find P(A and B). not A 0.4 B 0.2 not B 0.1 0.3
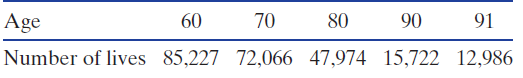
The US Social Security Administration collects information on the life expectancy and death rates of the population. Table 11.6 gives the number of US men out of 100,000 born alive who will survive to a given age, based on 2007 mortality rates.For example, 47,974 of 100,000 US males live to their
Table 11.3 gives probabilities for various combinations of events A, B, and their complements.Table 11.3Are events A and B independent? not A 0.4 B 0.2 not B 0.1 0.3
Table 11.3 gives probabilities for various combinations of events A, B, and their complements.Table 11.3Find P(B if A). not A 0.4 B 0.2 not B 0.1 0.3
Table 11.3 gives probabilities for various combinations of events A, B, and their complements.Table 11.3Find P(A if B). not A 0.4 B 0.2 not B 0.1 0.3
Table 11.3 gives probabilities for various combinations of events A, B, and their complements.Table 11.3Find P(A or B). not A 0.4 B 0.2 not B 0.1 0.3
Table 11.3 gives probabilities for various combinations of events A, B, and their complements.Table 11.3Find P(not B). not A 0.4 B 0.2 not B 0.1 0.3
Draw three skittles (possible colors: yellow, green, red, purple, and orange) from a bag. Let A be the event that all three skittles are green and B be the event that at least one skittle is red.State whether the two events (A and B) described are disjoint, independent, and/or complements. (It is
South Africa plays Australia for the championship in the Rugby World Cup. Let A be the event that Australia wins and B be the event that South Africa wins. (The game cannot end in a tie.)State whether the two events (A and B) described are disjoint, independent, and/or complements. (It is possible
South Africa plays Australia for the championship in the Rugby World Cup. At the same time, Poland plays Russia for the World Team Chess Championship. Let A be the event that Australia wins their rugby match and B be the event that Poland wins their chess match.State whether the two events (A and
Suppose that the probability function in Table 11.13 reflects the possible lifetimes (in months after emergence) for fruit flies.Table 11.13(a) What proportion of fruit flies die in their second month?(b) What is the probability that a fruit fly lives more than four months?(c) What is the mean
Roll two (six-sided) dice. Let A be the event that the first die is a 3 and B be the event that the sum of the two dice is 8.State whether the two events (A and B) described are disjoint, independent, and/or complements. (It is possible that the two events fall into more than one of the three
Each of the following statements demonstrate a common misuse of probability. Explain what is wrong with each statement:(a) Approximately 10% of adults are left-handed. So, if we take a simple random sample of 10 adults, 1 of them will be left-handed.(b) A pitch in baseball can be called a ball or a
About 20% of movies coming out of Hollywood are comedies, Warner Bros has been the lead studio for about 9% of recent movies, and about 2% of recent movies are comedies from Warner Bros. Let C denote the event a movie is a comedy and W denote the event a movie is produced by Warner Bros.(a) Write
Of the 213 countries or independent economies in the world recognized by the World Bank, 19% are classified by the World Bank as being developed. Are countries with a large land area more likely to be developed? We classify a country as large if its land area is greater than 500,000 square
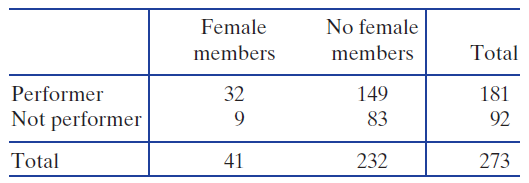
From its founding through 2012, the Rock and Roll Hall of Fame has inducted 273 groups or individuals. Table 11.4 shows how many of the inductees have been female or have included female members and also shows how many of the inductees have been performers. (The full dataset is available in
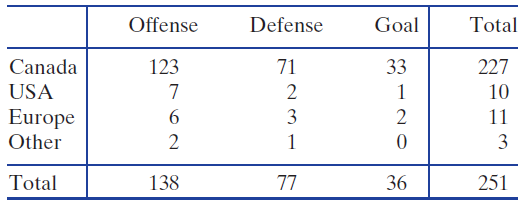
From its founding through 2012, the Hockey Hall of Fame has inducted 251 players. Table 11.5 shows number of players by place of birth and by position played. If a player is chosen at random from all player inductees into the Hockey Hall of Fame, let C represent the event of being born in Canada
In a bag of peanut M & M’s, there are 80 M & Ms, with 11 red ones, 12 orange ones, 20 blue ones, 11 green ones, 18 yellow ones, and 8 brown ones. They are mixed up so that each candy piece is equally likely to be selected if we pick one.(a) If we select one at random, what is the
As in Exercise 11.36, we have a bag of peanut M & M’s with 80 M & Ms in it, and there are 11 red ones, 12 orange ones, 20 blue ones, 11 green ones, 18 yellow ones, and 8 brown ones. They are mixed up so that each is equally likely to be selected if we pick one.(a) If we select one at
During the 2010-11 NBA season, Ray Allen of the Boston Celtics had a free throw shooting percentage of 0.881. Assume that the probability Ray Allen makes any given free throw is fixed at 0.881, and that free throws are independent.(a) If Ray Allen shoots two free throws, what is the probability
The most common form of color blindness is an inability to distinguish red from green. However, this particular form of color blindness is much more common in men than in women (this is because the genes corresponding to the red and green receptors are located on the X-chromosome). Approximately 7%
Approximately 7% of men and 0.4% of women are red-green color-blind (as in Exercise 11.39). Assume that a statistics class has 15 men and 25 women.(a) What is the probability that nobody in the class is red-green color-blind?(b) What is the probability that at least one person in the class is
The Standard and Poor 500 (S&P 500) is a weighted average of the stocks for 500 large companies in the United States. It is commonly used as a measure of the overall performance of the US stock market. Between January 1, 2009 and January 1, 2012, the S&P 500 increased for 423 of the 756
A friend makes three pancakes for breakfast. One of the pancakes is burned on both sides, one is burned on only one side, and the other is not burned on either side. You are served one of the pancakes at random, and the side facing you is burned. What is the probability that the other side is
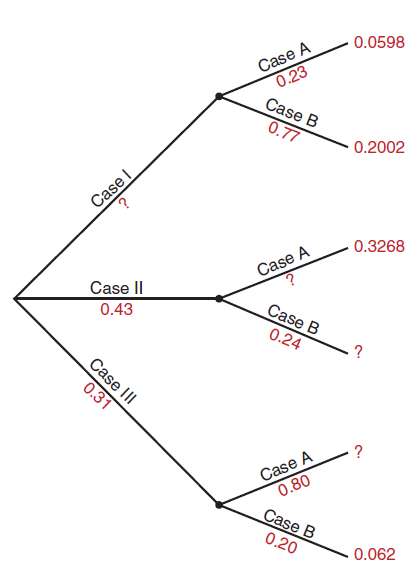
Complete each tree diagram by filling in the missing entries (marked with a €˜€˜?€). 0.0598 Case A 0.23 Case B 0.77 0.2002 Case I 0.3268 Case A Case II Case B 0.43 0.24 Case III 0.31 Case A 0.80 Case B 0.20 0.062
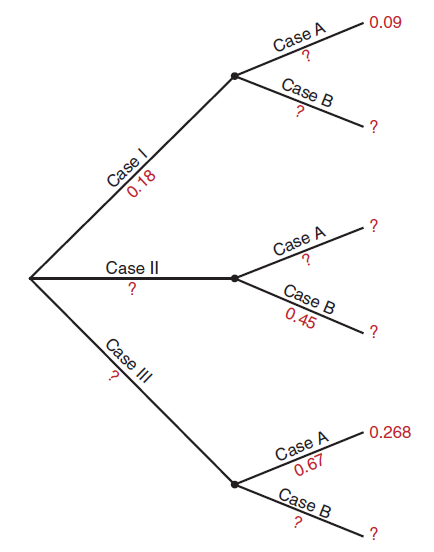
Complete each tree diagram by filling in the missing entries (marked with a €˜€˜?€). 0.09 Case A Case B Case 0.18 Case A Case II Case B 0.45 Case III 0.268 Case A 0.67 Case B
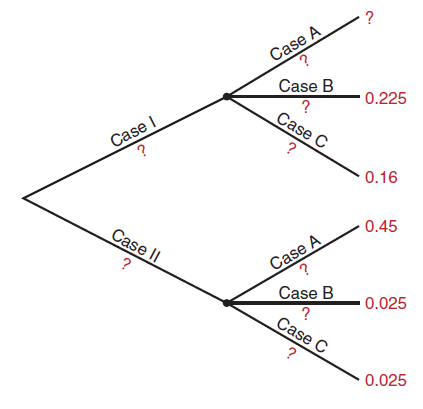
Complete each tree diagram by filling in the missing entries (marked with a €˜€˜?€). Case A Case B 0.225 Case C Case I 0.16 · 0.45 Case II Case A Case B 0.025 Case C 0.025
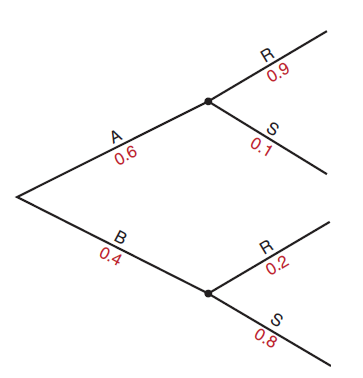
Find the requested probabilities using the tree diagram inFigure 11.4.P(S) 0.9 A 0.1 0.6 0.4 0.2 0.8
P(A if S)Find the requested probabilities using the tree diagram in Figure 11.4. 0.9 A 0.1 0.6 0.4 0.2 0.8
P(B if R)Find the requested probabilities using the tree diagram in Figure 11.4. 0.9 A 0.1 0.6 0.4 0.2 0.8
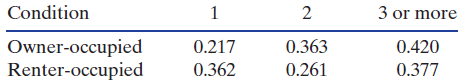
According to the 2010 US Census, 65% of housing units in the US are owner-occupied while the other 35% are renteroccupied. Table 11.7 shows the probabilities of the number of occupants in a housing unit under each of the two conditions. Create a tree diagram using this information and use it to
People with restless leg syndrome have a strong urge to move their legs to stop uncomfortable sensations. People with fibromyalgia suffer pain and tenderness in joints throughout the body. A recent study indicates that people with fibromyalgia are much more likely to have restless leg syndrome than
The mammogram is helpful for detecting breast cancer in its early stages. However, it is an imperfect diagnostic tool. According to one study, 86.6 of every 1000 women between the ages of 50 and 59 that do not have cancer are wrongly diagnosed (a ‘‘false positive”), while 1.1 of every 1000
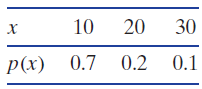
Use the probability function given in the table to calculate:(a) The mean of the random variable(b) The standard deviation of the random variable 10 20 30 p(x) 0.7 0.2 0.1
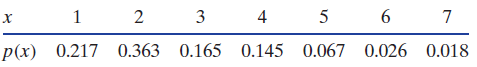
Table 11.11 in Exercise 11.83 gives the probability function for the random variable giving the household size for an owner-occupied housing unit in the US.Table 11.11(a) Find the mean household size.(b) Find the standard deviation for household size. 3 2 4 p(x) 0.217 0.363 0.165 0.145 0.067 0.026
To find the proportion of times something occurs, we divide the count (often a binomial random variable) by the number of trials n. Using the formula for the mean and standard deviation of a binomial random variable, derive the mean and standard deviation of a proportion resulting from n trials and
Suppose that past experience shows that about 10% of passengers who are scheduled to take a particular flight fail to show up. For this reason, airlines sometimes overbook flights, selling more tickets than they have seats, with the expectation that they will have some no shows. Suppose an airline
As we see in Exercise 11.38 on page 653, during the 2010-11NBA season, Ray Allen of the Boston Celtics had a free throw shooting percentage of 0.881. Assume that the probability Ray Allen makes any given free throw is fixed at 0.881, and that free throws are independent.(a) If Ray Allen shoots 8
Exercise 11.121 describes a random variable that counts the number of owneroccupied units in a sample of housing units. Use the information in that exercise to find the mean and standard deviation of this random variable.Exercise 11.121In the 2010 US Census, we learn that 65% of all housing units
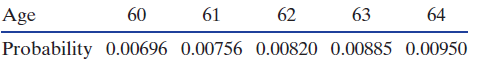
Exercise 11.120 describes a random variable that counts the number of senior citizens in a sample. Use the information in that exercise to find the mean and standard deviation of this random variable.Exercise 11.120In the 2010 US Census, we learn that 13% of all people in the US are 65 years old or
Exercise 11.119 describes a random variable that counts the number of college graduates in a sample. Use the information in that exercise to find the mean and standard deviation of this random variable.Exercise 11.119From the 2010 US Census, we learn that 27.5% of US adults have graduated from
In Exercise 11.118, we discuss the random variable counting the number of seniors in a sample of four undergraduate students at a university, given that the proportion of undergraduate students who are seniors is 0.25. Find the mean and standard deviation of this random variable.Exercise
In Exercise 11.117, we discuss the random variable counting the number of girls in three babies, given that the proportion of babies who are girls is about 0.49. Find the mean and standard deviation of this random variable.Exercise 11.117Worldwide, the proportion of babies who are boys is about
In the 2010 US Census, we learn that 65% of all housing units are owner-occupied while the rest are rented. If we take a random sample of 20 housing units, find the probability that:(a) Exactly 15 of them are owner-occupied(b) 18 or more of them are owner-occupied
In the 2010 US Census, we learn that 13% of all people in the US are 65 years old or older. If we take a random sample of 10 people, what is the probability that 3 of them are 65 or older? That 4 of them are 65 or older?
From the 2010 US Census, we learn that 27.5% of US adults have graduated from college. If we take a random sample of 12 US adults, what is the probability that exactly 6 of them are college graduates?
Suppose that undergraduate students at a university are equally divided between the four class years (first-year, sophomore, junior, senior) so that the probability of a randomly chosen student being in any one of the years is 0.25. If we randomly select four students, give the probability function
Worldwide, the proportion of babies who are boys is about 0.51. A couple hopes to have three children and we assume that the sex of each child is independent of the others. Let the random variable X represent the number of girls in the three children, so X might be 0, 1, 2, or 3. Give the
A binomial random variable with n = 800 and p = 0.25Calculate the mean and standard deviation of the binomial random variable.
Abinomial random variable with n = 30 and p = 0.5Calculate the mean and standard deviation of the binomial random variable.
A binomial random variable with n = 10 and p = 0.8Calculate the mean and standard deviation of the binomial random variable.
A binomial random variable with n = 6 and p = 0.4Calculate the mean and standard deviation of the binomial random variable.
Find P(X = 8) if X is a binomial random variable with n = 12 and p = 0.75.Calculate the requested binomial probability.
Find P(X = 3) if X is a binomial random variable with n = 10 and p = 0.4.Calculate the requested binomial probability.
Find P(X = 7) if X is a binomial random variable with n = 8 and p = 0.9.Calculate the requested binomial probability.
Find P(X = 2) if X is a binomial random variable with n = 6 and p = 0.3.Calculate the requested binomial probability.
Calculate the requested quantity.
Calculate the requested quantity. (10)
Calculate the requested quantity. 2
Calculate the requested quantity. 8' 3,
Calculate the requested quantity.6!
Calculate the requested quantity.8!
Calculate the requested quantity.7!
Calculate the requested quantity.4!
Worldwide, the proportion of babies who are boys is about 0.51. We randomly sample 100 babies born and count the number of boys.Determine whether the process describes a binomial random variable. If it is binomial, give values for n and p. If it is not binomial, state why not.
Suppose 30% of students at a large university take Intro Stats. Randomly sample 75 students from this university and count the number who have taken Intro Stats.Determine whether the process describes a binomial random variable. If it is binomial, give values for n and p. If it is not binomial,
Sample 50 students who have taken Intro Stats and record the final grade in the course for each.Determine whether the process describes a binomial random variable. If it is binomial, give values for n and p. If it is not binomial, state why not.
Roll a die until you get 5 sixes and count the number of rolls required.Determine whether the process describes a binomial random variable. If it is binomial, give values for n and p. If it is not binomial, state why not.
Count the number of sixes in 10 dice rolls.Determine whether the process describes a binomial random variable. If it is binomial, give values for n and p. If it is not binomial, state why not.
In a certain board game participants roll a standard six-sided die and need to hit a particular value to get to the finish line exactly. For example, if Carol is three spots from the finish, only a roll of 3 will let her win; anything else and she must wait another turn to roll again. The chance of
Frank Benford, a physicist working in the 1930s, discovered an interesting fact about some sets of numbers. While you might expect the first digits of numbers such as street addresses or checkbook entries to be randomly distributed (each with probability 1/9), Benford showed that in many cases the
An Internet Service Provider (ISP) offers its customers three options:• Basic: Standard internet for everyday needs, at $23.95 per month.• Premium: Fast internet speeds for streaming video and downloading music, at $29.95 per month.• Ultra: Super-fast internet speeds for online gaming, at
A non-profit organization plans to offer a life insurance service. Participants agree to a five-year contract in which they pay the organization a yearly fee. The fee does not change over the course of the contract. If the policy holder dies during the five-year period, the organization will pay
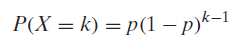
As we see in Exercise 11.38 on page 653, during the 2010–11 NBA season, Ray Allen of the Boston Celtics had a free throw shooting percentage of 0.881. Assume that the probability Ray Allen makes any given free throw is fixed at 0.881, and that free throws are independent. Let X be the number of
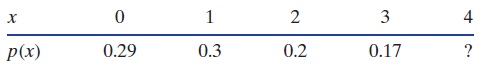
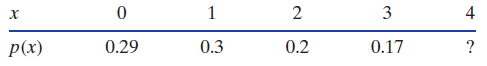
Refer to Table 11.14 in Exercise 11.88 that gives probabilities for the number of used cars a dealer sells in a day. What is the probability that the dealership sells no cars on three consecutive days? (Assume daily sales are independent.)Table 11.14 3 х 0.29 0.3 0.17 |Р(х) 0.2 4. 2.
Refer to Table 11.13 in Exercise 11.87 that gives probabilities for fruit fly lifetimes.Table 11.13(a) If we know a fruit fly died before the end of its second month, what is the probability it died in its first month?(b) If a fruit fly makes it past its second month, what is the probability it
A used car dealership uses past data to estimate the probability distribution for the number of cars they sell in a day, X. The probability distribution of X is given inTable 11.14.(a) What is P(X = 4)?(b) What is the probability that the dealership sells less than two cars during a day?(c) What is
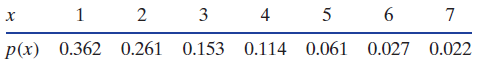
Table 11.12 in Exercise 11.84 gives the probability function for the random variable giving the household size for a renter-occupied housing unit in the US.Table 11.12(a) Find the mean household size.(b) Find the standard deviation for household size. 1 2 3 4 5 6 p(x) 0.362 0.261 0.153 0.114 0.061
Table 11.12 gives the probability function for the random variable giving the household size for a renter-occupied housing unit in the US.Table 11.12(a) Verify that the sum of the probabilities is 1 (up to round-off error.)(b) What is the probability that a unit has only one or two people in it?(c)
Table 11.11 gives the probability function for the random variable giving the household size for an owneroccupied housing unit in the US. Table 11.11(a) Verify that the sum of the probabilities is 1 (up to round-off error).(b) What is the probability that a unit has only one or two people in
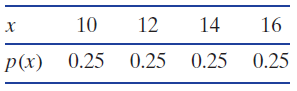
Use the probability function given in the table to calculate:(a) The mean of the random variable(b) The standard deviation of the random variable 12 10 16 14 p(x) 0.25 0.25 0.25 0.25
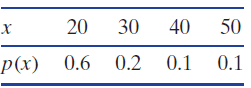
Use the probability function given in the table to calculate:(a) The mean of the random variable(b) The standard deviation of the random variable х 20 30 40 50 0.1 p(x) 0.6 0.2 0.1
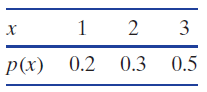
Use the probability function given in the table to calculate:(a) The mean of the random variable(b) The standard deviation of the random variable 2 3 х 0.5 p(x) 0.2 0.3
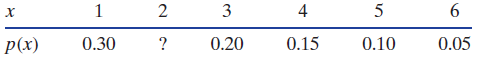
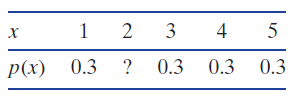
Fill in the ? to make p(x) a probability function. If not possible, say so. 3 4 х p(x) 0.3 ? 0.3 0.3 0.3
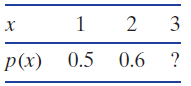
Fill in the ? to make p(x) a probability function. If not possible, say so. 2 3 ? p(x) 0.5 0.6
Showing 300 - 400
of 2108
1
2
3
4
5
6
7
8
9
10
11
12
13
14
15
Last
Step by Step Answers