New Semester
Started
Get
50% OFF
Study Help!
--h --m --s
Claim Now
Question Answers
Textbooks
Find textbooks, questions and answers
Oops, something went wrong!
Change your search query and then try again
S
Books
FREE
Study Help
Expert Questions
Accounting
General Management
Mathematics
Finance
Organizational Behaviour
Law
Physics
Operating System
Management Leadership
Sociology
Programming
Marketing
Database
Computer Network
Economics
Textbooks Solutions
Accounting
Managerial Accounting
Management Leadership
Cost Accounting
Statistics
Business Law
Corporate Finance
Finance
Economics
Auditing
Tutors
Online Tutors
Find a Tutor
Hire a Tutor
Become a Tutor
AI Tutor
AI Study Planner
NEW
Sell Books
Search
Search
Sign In
Register
study help
mathematics
statistics the art and science
Statistics Unlocking The Power Of Data 1st Edition Robin H. Lock, Patti Frazer Lock, Kari Lock Morgan, Eric F. Lock, Dennis F. Lock - Solutions
Use data collected at an online shopping site to estimate the proportion of people visiting the site who make a purchase.Identify the method of analysis needed to answer the question. Indicate whether we should conduct a hypothesis test or find a confidence interval and also indicate whether the
Use data collected from a sample of applicants at a college admissions office to measure how large the difference is in the average size of the financial aid package between early decision applicants and regular decision applicants.Identify the method of analysis needed to answer the question.
Use data from a study done at a college fitness center in which muscle mass of participants was measured before and after a 6-week program working with resistance bands to estimate the mean increase in muscle mass.Identify the method of analysis needed to answer the question. Indicate whether we
Use a sample of students at a large university to determine whether the proportion of students at the university who are left-handed is different from the national US proportion of 12%.Identify the method of analysis needed to answer the question. Indicate whether we should conduct a hypothesis
Use results from a survey to estimate the difference in the proportion of males and females who say they are trying to lose weight.Identify the method of analysis needed to answer the question. Indicate whether we should conduct a hypothesis test or find a confidence interval and also indicate
A recent headline states that ‘‘73% say Woman President Likely in Next 10 Years.” The report gives the results of a survey of 1000 randomly selected likely voters in the US. Find and interpret a 95% confidence interval for the proportion of likely voters in the US who think a woman president
Can rats feel empathy toward fellow rats? In a recent study, some rats were first habituated to two chambers: a witness chamber adjacent to a shock chamber. The experimental rats (n = 15) were then given electric shocks through the floor of the shock chamber, while the control rats (n = 11)
In Exercise B.6 on page 306 we look at some data on the results of overtime games in the National Football League (NFL) from 1974 through the 2009 season. The question of interest is how much advantage (if any) is given to the team that wins the coin flip at the start of the sudden death overtime
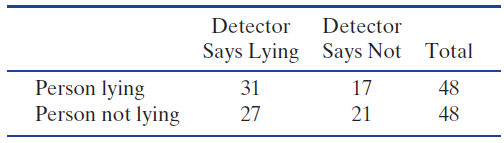
Find and interpret a 90% confidence interval for the proportion of times a lie detector accurately detects a lying person.Refer to the data in Table C.5. These data, introduced in Exercise A.23 on page 147, involve participants who read either deceptive material or truthful material while hooked to
Test to see if there is evidence that the lie detector says a person is lying more than 50% of the time, regardless of what the person reads. Refer to the data in Table C.5. These data, introduced in Exercise A.23 on page 147, involve participants who read either deceptive material or
Test to see if there is a difference in the proportion the lie detector says is lying depending on whether the person is lying or telling the truth.Refer to the data in Table C.5. These data, introduced in Exercise A.23 on page 147, involve participants who read either deceptive material or
Find and interpret a 95% confidence interval for the difference in the proportion the lie detector says is lying between those lying and those telling the truth.Refer to the data in Table C.5. These data, introduced in Exercise A.23 on page 147, involve participants who read either deceptive
Asurvey conducted of 1502 randomly selected US adults found that 931 of them believed the government does not provide enough support for soldiers returning from Iraq or Afghanistan. Use this information to construct a 99% confidence interval. Clearly define the parameter you are estimating.
Arsenic is toxic to humans, and people can be exposed to it through contaminated drinking water, food, dust, and soil. Exercises 2.51 and 2.103 on pages 71 and 87, respectively, describe an interesting new way to measure a person€™s level of arsenic poisoning: by examining toenail
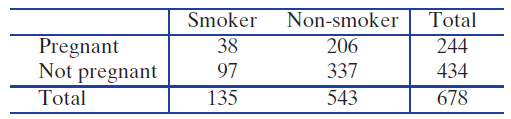
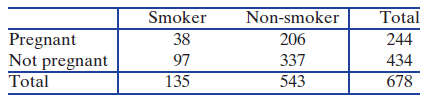
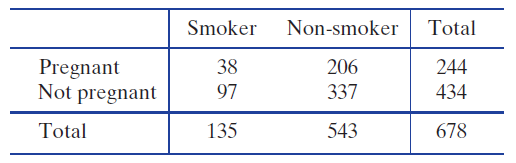
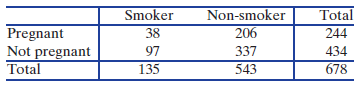
Exercise 2.25 on page 57 introduces a study investigating whether smoking might negatively effect a person€™s ability to become pregnant. The study collected data on 678 women who had gone off birth control with the intention of becoming pregnant. Smokers were defined as those who smoked
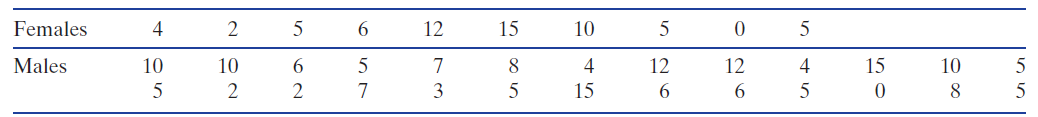
In the StudentSurvey data, there are 36 seniors: 26 males and 10 females. Table C.9 gives the number of hours per week that each said he or she spent exercising. Find a 95% confidence interval for the difference in mean time spent exercising between male and female seniors at this university.Table
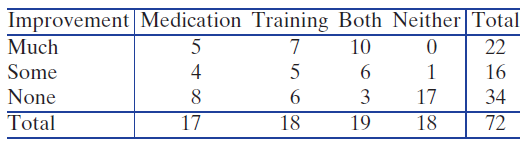
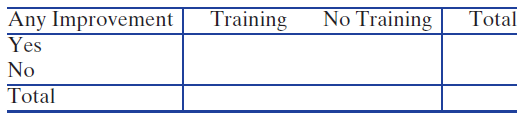
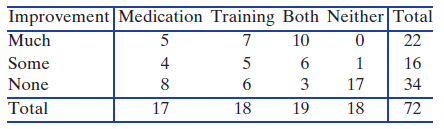
Exercise A.32 on page 149 introduces a study investigating the effectiveness of behavioral changes and prescription medication in helping older people find improvement in fighting insomnia. The results are summarized inTable C.10.(a) Some of the counts in the cells are very small, definitely too
The typical resting pulse rate in adults is 60 to 80 beats per minute. For the 200 Intensive Care Unit patients in the dataset ICUAdmissions, the average pulse rate in the sample is x̅ = 98.9 bpm with s = 26.8 bpm. Test to see if this provides evidence that the average pulse rate of ICU patients
Honeybee colonies have specific ‘‘scout” honeybees, that are entrusted with finding new sites for hives. The mean age of honeybees in a hive is about 12 days. In a sample of 50 scout honeybees, the average age is 29.1 days with a standard deviation of 5.6. Does this provide evidence that
Tribulus is a food supplement that some athletes use to enhance performance. A study on the effects of this supplement involved randomly assigning 20 athletes to take the supplement for a 20 day period and comparing various characteristics to 12 similar athletes who were not given Tribulus. One of
CAOS Comparisons Anarticle by the developers of the CAOS exam described in Exercise C.68 gives benchmark data based on a very large number of students taking the CAOS pretest and posttest. The mean score on the CAOS pretest was 44.9 and the mean on the CAOS postest was 54.0 for an average
We have seen in earlier exercises that the conditions are met for using a regression line to predict the Tip from the size of the Bill. Some regression output is shown for fitting this linear model:The regression equation isTip = - 0.292 + 0.182 BillS = 0.979523 R-Sq = 83.7% R-Sq(adj) = 83.6%(a)
ANOVA for difference in means for 100 people separated into six groups with F-statistic = 2.51A test statistic for one of the tests in this unit is given, along with information about sample size(s) or degrees of freedom. Give the p-value and indicate whether the results are significant at the 5%
A two-tailed test for the coefficient of the first predictor in a three-predictor regression model with t-statistic = 1.83 and n = 26A test statistic for one of the tests in this unit is given, along with information about sample size(s) or degrees of freedom. Give the p-value and indicate whether
Testing to see if there is evidence that the mean time spent studying per week is different between first-year students and upperclass students.Describe how you might physically create one randomization sample and compute one randomization statistic (without using any technology) from a given
Testing to see if average sales are higher in stores where customers are approached by salespeople than in stores where they aren’t.Describe how you might physically create one randomization sample and compute one randomization statistic (without using any technology) from a given sample. Be
Testing to see if there is evidence that the percentage of a population who watch the Home Shopping Network is less than 20%.Describe how you might physically create one randomization sample and compute one randomization statistic (without using any technology) from a given sample. Be explicit
Testing to see if there is evidence that a correlation between height and salary is significant (that is, different than zero.)Describe how you might physically create one randomization sample and compute one randomization statistic (without using any technology) from a given sample. Be explicit
Testing to see if there is evidence that the proportion of people who smoke is greater for males than for females.Describe how you might physically create one randomization sample and compute one randomization statistic (without using any technology) from a given sample. Be explicit enough that a
Use StatKey or other technology to create the randomization distribution for the situation in Exercise B.48. Use the distribution to calculate a p-value. Using α = 0.05, state the conclusion in context.Exercise B.48The dataset FloridaLakes is introduced in Data 2.4 on page 68, and we return to the
The dataset FloridaLakes is introduced in Data 2.4 on page 68, and we return to the dataset in Exercise B.45 on page 315. To see if there is evidence of a negative correlation between pH in lakes and mercury levels in fish, the hypotheses are H0: ρ = 0 vs Ha: ρ < 0. For the observed sample,
Exercise B.38 on page 314 describes a randomized trial in South Africa to test whether the proportion of babies born with infections is smaller if women in labor are treated with a wipe containing chlorohexidine rather than a sterile wipe (the placebo). A sample of n = 481 pregnant women were
In Data 4.5 on page 228 we describe a situation in which a restaurant chain will test for arsenic levels in a sample of chickens from a supplier. If there is evidence that the average level of arsenic is over 80 ppb, the chain will permanently cancel its relationship with the supplier. The null and
Exercise 3.84 on page 204 describes the variable Distance for the Atlanta commuter sample stored in CommuteAtlanta, giving the distance of each commute (in miles). Use StatKey or other technology to create a distribution with the mean distances for 1000 bootstrap samples and use it to find and
It is estimated that in the general population about 9 out of every 1000, or 0.009, children are diagnosed with autism. A recent study included 92 six-month-old babies who had a sibling with autism. Twenty-eight of these babies were later diagnosed with autism. Use StatKey or other technology to
In Exercise B.40, we learn that when 48 stressed individuals read a truthful passage while being hooked up to a lie detector, the lie detection software inaccurately reported deception by 27 of them. Does this sample provide evidence that lie detection software will give inaccurate results more
Is lie detection software accurate? Exercise A.23 on page 147 describes a study in which 48 individuals read a truthful passage while under stress and while connected to a lie detector. The lie detection software inaccurately reported deception in 57% of the cases. A bootstrap distribution shows an
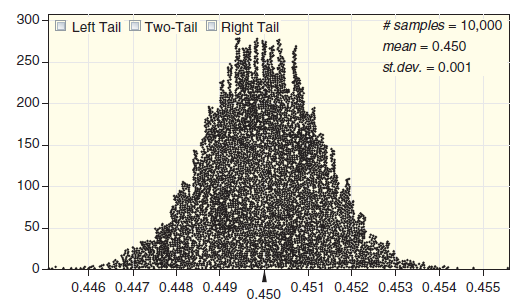
In Exercise 3.52 on page 189, we discuss a Gallup poll stating that the proportion of American adults getting health insurance from an employer is estimated to be 0.45. We are also told that, with 95% confidence, €˜€˜the maximum margin of sampling error is±1 percentage
The Centers for Disease Control and Prevention (CDC) conducted a randomized trial in South Africa designed to test the effectiveness of an inexpensive wipe to be used during childbirth to prevent infections. Half of the mothers were randomly assigned to have their birth canal wiped with a wipe
Does heavy cell phone use increase the incidence of brain tumors? Astudy of cell phone use among 10,000 participants found that ‘‘the 10% who used their phones most often and for the longest time had a 40% higher risk of developing some form of brain cancer than those who didn’t use a mobile
Data 2.7 on page 93 introduces the dataset HollywoodMovies2011, which contains information on all the 136 movies that came out of Hollywood in 2011.(a) Find the mean and standard deviation for the budgets (in millions of dollars) of all 2011 Hollywood movies. Use the correct notation with your
Internet One of the variables in the AllCountries dataset gives the percent of the population of each country with access to the Internet. This information is available for all 199 countries (ignoring a few with missing values). We are interested in the average percent with Internet access.(a) What
Exercise B.33 describes a study on the use of ketamine in treating depression in mice. Ten depressed mice given the drug had a mean score of 135 seconds on a forced-swim test used to measure depression (lower scores indicate less depression). The usual mean for depressed mice on this test is about
Traditional antidepressants often take weeks or months to improve symptoms. A new study may provide a faster acting option. The anesthetic ketamine is very dangerous and can be deadly at high doses. However, low doses appear to have a rapid effect on levels of a brain compound linked to depression.
The Super Bowl is the final championship game in the National Football League in the US and is one of the most watched television events of the year. In January 2016, just before Super Bowl 50, a random sample of 7293 American adults were asked if they plan to watch the Super Bowl, 4230 indicated
In Example 3.25 on page 207, we compare the mean hours of exercise per week between male and female college students. The sample results are included in the dataset Exercise Hours, where we see that the 20 men in the sample exercised for an average of 12.4 hours per week and the 30 women in the
What is the expected center of a bootstrap distribution generated to find a confidence interval? What is the expected center of a randomization distribution generated to test a hypothesis?
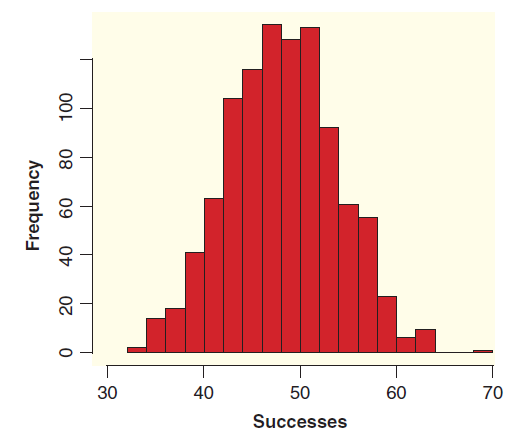
Exercises B.24 and B.25 describe a study to determine whether a sales tax on soda will reduce consumption of soda in the US below the current per-capita level of about 50 gallons of soda per year. The hypotheses for the test are H0: μ = 50 vs Ha: μ < 50, where
From its founding through 2012, the Rock and Roll Hall of Fame has inducted 273 groups or individuals, and 181 of the inductees have been performers while the rest have been related to the world of music in some way other than as a performer. The full dataset is available at RockandRoll. Some of
Given a specific sample to estimate a specific parameter from a population, what are the expected similarities and differences in the corresponding sampling distribution (using the given sample size) and bootstrap distribution (using the given sample)? In particular, for each aspect of a
Data 2.7 on page 93 introduced the dataset Hollywood- Movies2011, which contains information on all the 136 movies that came out of Hollywood in 2011. Thirty-two of the Hollywood movies that year were classified as action movies.(a) What proportion of Hollywood movies in 2011 were action movies?
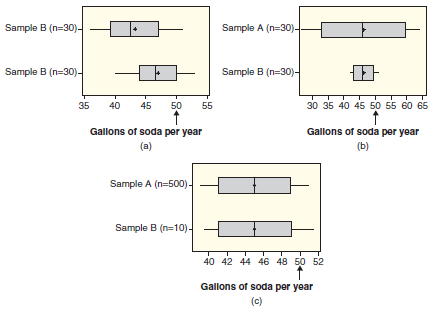
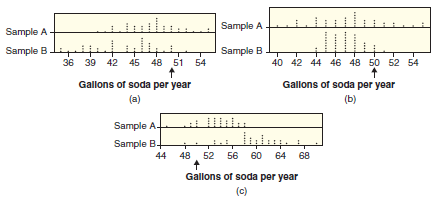
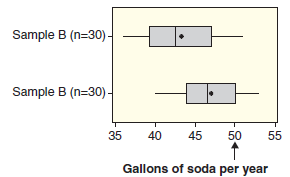
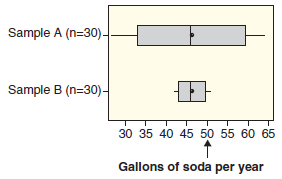
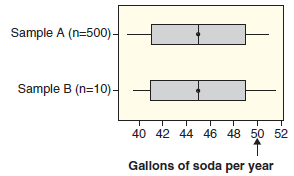
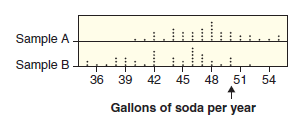
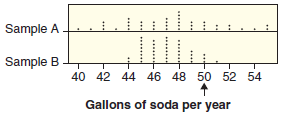
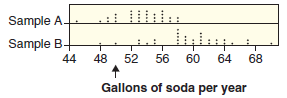
We extend the situation described in Exercise B.24 to each of the pairs of boxplots in Figure B.9. In each case, indicate whether the results of Sample A or Sample B show stronger evidence that average consumption of taxed soda is below 50, or state that neither sample shows evidence of this.
The average American drinks approximately 50 gallons of soda (pop) a year, delivering approximately 50,000 calories and no nutrition. Some legislators are recommending instituting a sales tax on soda to raise revenue and fight obesity. Will a sales tax impact consumption? Suppose that a sales tax
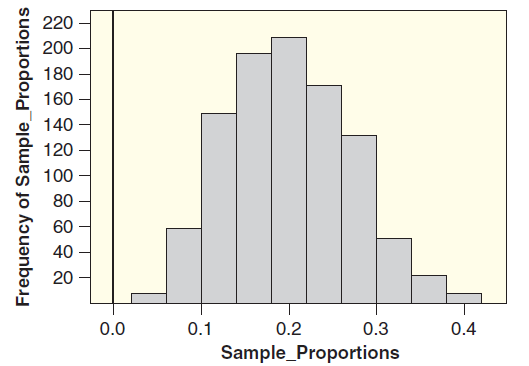
Exercise B.22 discusses a study to see if smoking might be negatively related to a woman€™s ability to become pregnant. The study looks at the proportion of successful pregnancies in two groups, smokers and non-smokers, and the results are summarized in Table B.6. In this exercise, we are
Exercise 2.25 on page 57 introduces a study of 678 women who had gone off birth control with the intention of becoming pregnant. Table B.6 includes information on whether or not a woman was a smoker and whether or not the woman became pregnant during the first cycle. We wish to estimate the
According to a recent survey, most Americans prefer to watch a movie in the comfort of their own home rather than going out to a theater. In the telephone survey of 1000 randomly selected American adults, 56% say they rarely or never go out to the movies, while 32% go ‘‘occasionally” and 12%
We select a random sample of n = 10 textbooks at a university bookstore and are testing to see if there is evidence that the average price of textbooks at that store is greater than $100. Give an example of possible sets of 10 prices that would provide:(a) Strong evidence that the average price of
A pizza delivery person was interested in knowing how she spends her time and what her actual hourly earnings are, so she recorded all of her deliveries and tips and how she spent every minute of her time over three shifts, on one Friday night and two Saturday nights. She discusses the results, and
In Example 3.17 on page 186, we learn that, in a random sample of over 450,000 US adults, the proportion of people who say they exercised at some point in the last 30 days is p̂ = 0.726 with a standard error of SE = 0.0007. Find and interpret a 95% confidence interval for the proportion of US
Many professors do not like having cell phones ring during class. A recent study appears to justify this reaction, by showing that a ringing cell phone can adversely affect student learning. In the experiment, students in a college classroom were exposed to a ringing cell phone during a psychology
The dataset HollywoodMovies2011 contains information on all 136 movies to come out of Hollywood in 2011. We see in Exercise B.13 that 27 of the movies were comedies. If we take 1000 samples of size n = 25 from this dataset and record the proportion of movies in the sample that are comedies, we get
Data 2.7 on page 93 introduces the dataset HollywoodMovies2011, which contains information on all 136 movies to come out of Hollywood in 2011. Twenty-seven of those movies were comedies.(a) What proportion of Hollywood movies in 2011 were comedies? Use the correct notation with your answer.(b) If
Scientists hoping to curb deforestation estimate that the carbon stored in tropical forests in Latin America, sub-Saharan Africa, and southeast Asia has a total biomass of 247 gigatons spread over 2.5 billion hectares. The scientists measured carbon levels at 4079 inventory plots and also used
A recent national telephone survey reports that 57% of those surveyed think violent movies lead to more violence in society. The survey included a random sample of 1000 American adults and reports: ‘‘The margin of sampling error is +/- 3 percentage points with a 95% level of confidence.”(a)
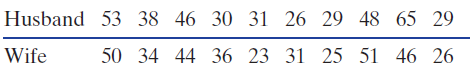
Exercise B.8 describes data on ages of husbands and wives at the time of marriage.(a) Do you expect the correlation between the ages at marriage of husbands and wives to be positive, negative, or near zero? Explain.(b) Using the data in MarriageAges, find the sample correlation and display the data
A sample of marriage licenses from 2010 to 2011 in St. Lawrence County in Northern New York State gives the ages of husbands and wives at the time of marriage for 105 newly married couples. The data are stored in MarriageAges and the first few cases from this file are shown in Table B.4. The
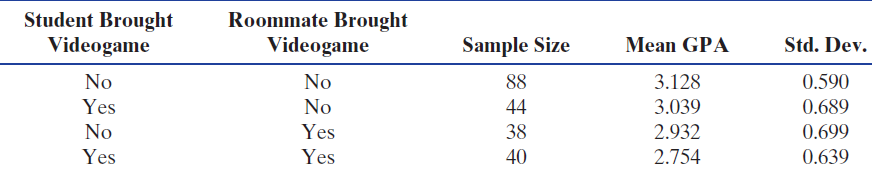
How much of an effect does your roommate have on your grades? In particular, does it matter whether your roommate brings a videogame to college? A study examining this question looked at n = 210 students entering Berea College as first-year students in the Fall of 2001 who were randomly assigned a
Overtime The National Football League (NFL) has used a sudden death overtime period since 1974 to help decide a winner in games that are tied at the end of regulation time. Before the overtime starts, a coin flip is used to determine which team gets the ball first. Some critics of the system
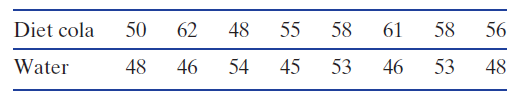
Calcium Arecent study examined the effect of diet cola consumption on calcium levels in women. A sample of 16 healthy women aged 18 to 40 were randomly assigned to drink 24 ounces of either diet cola or water. Their urine was collected for three hours after ingestion of the beverage and calcium
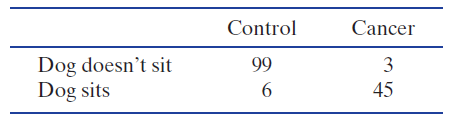
Can dogs provide an easy noninvasive way to detect cancer? Several methods have been used to test this. In a recent study,50 five dogs were trained over a three week period to smell cancer in breath samples. To collect the data, cancer patients who had just been diagnosed and had not yet started
A study conducted on a college campus tested to see whether students with colds who are given large doses of vitamin C recover faster than students who are not given the vitamin C. The p-value for the test is 0.003.(a) Given the p-value, what is the conclusion of the test: Reject H0 or do not
For each question, indicate whether it is best assessed by using a confidence interval, a hypothesis test, or whether statistical inference is not relevant to answer it. If inference is not relevant, explain why.(a) What proportion of people using a public restroom wash their hands after going to
For each question, indicate whether it is best assessed by using a confidence interval, a hypothesis test, or whether statistical inference is not relevant to answer it. If inference is not relevant, explain why.(a) What percent of US voters support instituting a national kindergarten through 12th
The dataset HomesForSale has data on houses available for sale in three Mid- Atlantic states (NY, NJ, and PA) and California (CA). We are interested in the proportion of Mid- Atlantic houses that are larger than the mean US household size, which is approximately 2700 square feet. In the sample of
The dataset HomesForSale has data on houses available for sale in three Mid-Atlantic states (NY, NJ, and PA) as well as California (CA). In Exercise C.62 we see that in the sample of 90 Mid- Atlantic homes for sale, 16 are larger than the national average. In the sample of 30 California homes, 7
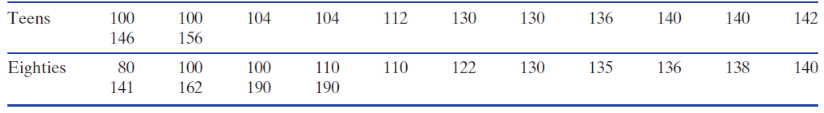
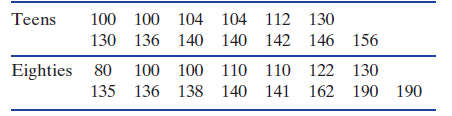
Table C.13 gives systolic blood pressure readings (first introduced in Exercise A.36 on page 150) for Intensive Care Unit patients in their teens and those in their eighties.Table C.13(a) Find and interpret a 95% confidence interval for the mean systolic blood pressure for each group. Which has a
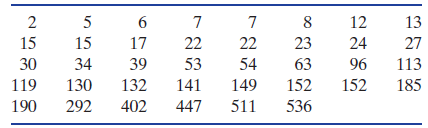
Patients Exercise 2.135 on page 100 discusses a study showing the recurrence time to infection at the point of insertion of the catheter for kidney patients using portable dialysis equipment. There are 38 patients, and the mean time to infection is xÌ… = 111.7 days with s = 144.0.(a)
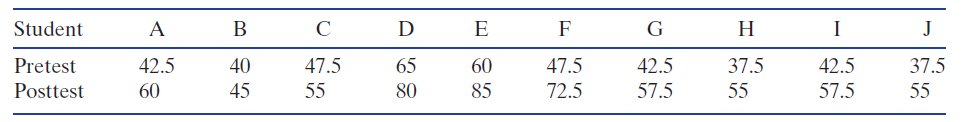
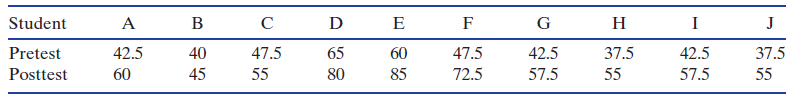
The Comprehensive Assessment of Outcomes in Statistics (CAOS) exam is an online multiple-choice test on concepts covered in a typical introductory statistics course. Students can take a pretest version before instruction and then a posttest version after instruction. Scores on the pretest and
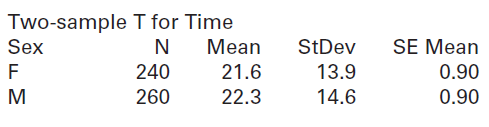
Some computer output is shown on the next page from an analysis to compare mean commute time between males and females using data from St. Louis commuters in CommuteStLouis. Write a paragraph interpreting what this output shows about the relationship (if any) between commuting time and gender in
Exercise C.70 gives computer output comparing mean commute time between males and females in the city of St. Louis. Use the data in CommuteAtlanta to see if a similar relationship (or lack of relationship) holds in Atlanta. Include both a confidence interval and test for the difference in mean
Dr. Jeremy Groves, a British anaesthetist, often uses a bicycle for his 27-mile round-trip commute to work. He bought an expensive, lightweight, carbon bike but also had an older, heavier, steel bike—so he decided to do an experiment. On each day he biked to work he flipped a coin to determine
Exercise B.8 on page 307 introduces the MarriageAges dataset that contains the ages for husbands and wives from a sample of 105 marriage licenses in St. Lawrence County, New York. In that exercise we use bootstrap and randomization methods to compare ages between husbands and wives. Repeat the
Refer to Exercise C.73 for a description of the data in Marriage Ages for a sample of 105 newly married couples.(a) Use technology to find the mean age for the wives in this sample and construct a 95% confidence interval for the mean age at marriage for wives in the population.(b) Repeat part (a)
Exercise 2.144 on page 102 describes a study conducted by engineers in Dresden, Germany looking at ways to improve traffic flow by enabling traffic lights to communicate with each other in real time. They simulated buses moving along a street and recorded the delay time (in seconds) for both the
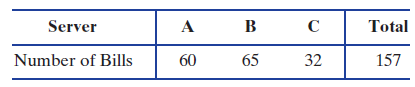
The data come from three different servers, coded as A, B, and C to preserve anonymity. The number of bills for each server is shown in Table D.5. Do the servers serve equal numbers of tables?Table D.5In Data 2.12 on page 119, we introduce the dataset RestaurantTips containing information on the
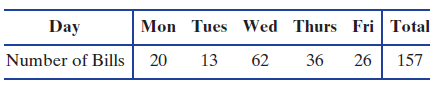
The number of bills for each day of the week is shown in Table D.6. Does this provide evidence that some days of the week are more popular (have more bills) than others?Table D.6In Data 2.12 on page 119, we introduce the dataset RestaurantTips containing information on the tipping patterns of
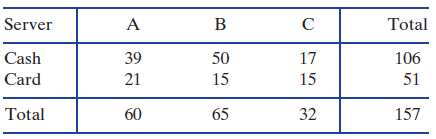
The data come from three different servers, coded as A, B, and C, and we also have information on whether or not a credit (or debit) card was used to pay the bill rather than cash. The frequency counts are shown in the two-way table in Table D.7. At a 5% significance level, is there an association
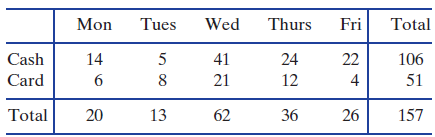
The data come from all five week days and we also have information on whether or not a credit (or debit) card was used to pay the bill rather than cash. The frequency counts are shown in the two-way table in Table D.8. Find the chi-square statistic for this two-way table. Are the conditions met to
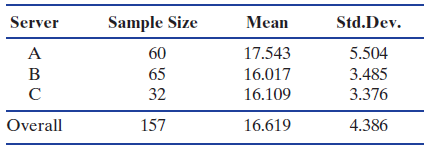
Most restaurant patrons leave a tip between 15% and 20% of the bill, and some restaurant customers determine the percent tip to leave based on the quality of service. Summary statistics for mean tip percentage left between the three servers, coded A, B, and C, are given in Table D.9. Is there a
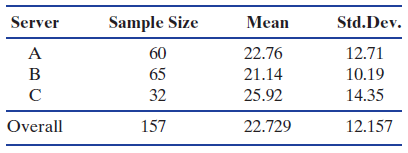
Are some servers given the big spenders (or large groups) while others tend to those having only a cup of coffee or a glass of wine? Is there a difference in the mean size of the bill between the three different servers? Summary statistics for mean bill size between the three servers, coded A, B,
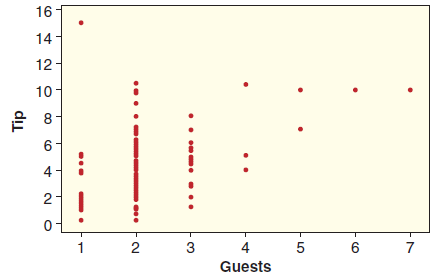
Do larger parties tend to leave a larger tip? Figure D.3 shows a scatterplot between the size of the tip and the number of guests.Figure D.3(a) Does there appear to be an association in the data between number of guests and tip size? If so, is it positive or negative? Are there any outliers?(b) The
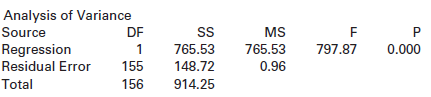
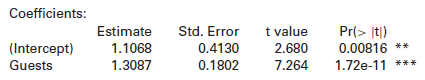
How much larger do tips get with larger parties? Figure D.3 shows a scatterplot between the size of the tip and the number of guests. Output regressing Tip on Guests is shown below:Figure D.3Residual standard error: 2.098 on 155 degrees of freedomMultiple R-squared: 0.254, Adjusted R-squared:
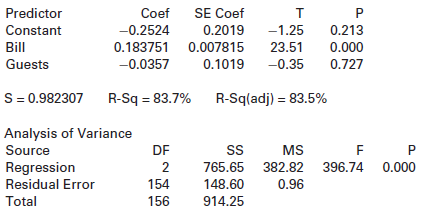
In Exercise D.9, we use the size of the bill to predict the tip. In this exercise, we use both the size of the bill and the number of guests to predict the size of the tip. Some regression output is shown for this analysis:The regression equation isTip = ˆ’ 0.252 + 0.184 Bill ˆ’
An upper-tail test for correlation with t-statistic = 1.36 and df = 15A test statistic for one of the tests in this unit is given, along with information about sample size(s) or degrees of freedom. Give the p-value and indicate whether the results are significant at the 5% level.
An analysis of variance test with F-statistic = 7.42 and df-numerator= 3 and df-denominator= 56A test statistic for one of the tests in this unit is given, along with information about sample size(s) or degrees of freedom. Give the p-value and indicate whether the results are significant at the 5%
A chi-square goodness-of-fit test with χ2-statistic = 4.18 and 5 groupsA test statistic for one of the tests in this unit is given, along with information about sample size(s) or degrees of freedom. Give the p-value and indicate whether the results are significant at the 5% level.
A two-tailed test for slope in a one-predictor regression model with t-statistic = 2.89 and n = 30A test statistic for one of the tests in this unit is given, along with information about sample size(s) or degrees of freedom. Give the p-value and indicate whether the results are significant at the
A chi-square test for a 2 × 4 table with χ2-statistic = 6.83A test statistic for one of the tests in this unit is given, along with information about sample size(s) or degrees of freedom. Give the p-value and indicate whether the results are significant at the 5% level.
A lower-tail test for correlation with t-statistic = −4.51 and n = 81A test statistic for one of the tests in this unit is given, along with information about sample size(s) or degrees of freedom. Give the p-value and indicate whether the results are significant at the 5% level.
Three different drugs are being tested on patients who have leukemia and the response variable is white blood cell count.In this unit, we have covered six specific tests, listed below. For each situation given in identify which of these tests is most appropriate. If multiple tests are appropriate,
Showing 100 - 200
of 2108
1
2
3
4
5
6
7
8
9
10
11
12
13
14
15
Last
Step by Step Answers