New Semester
Started
Get
50% OFF
Study Help!
--h --m --s
Claim Now
Question Answers
Textbooks
Find textbooks, questions and answers
Oops, something went wrong!
Change your search query and then try again
S
Books
FREE
Study Help
Expert Questions
Accounting
General Management
Mathematics
Finance
Organizational Behaviour
Law
Physics
Operating System
Management Leadership
Sociology
Programming
Marketing
Database
Computer Network
Economics
Textbooks Solutions
Accounting
Managerial Accounting
Management Leadership
Cost Accounting
Statistics
Business Law
Corporate Finance
Finance
Economics
Auditing
Tutors
Online Tutors
Find a Tutor
Hire a Tutor
Become a Tutor
AI Tutor
AI Study Planner
NEW
Sell Books
Search
Search
Sign In
Register
study help
mathematics
statistics the art and science
Statistics Unlocking The Power Of Data 1st Edition Robin H. Lock, Patti Frazer Lock, Kari Lock Morgan, Eric F. Lock, Dennis F. Lock - Solutions
Three different drugs are being tested on patients who are HIV-positive and the response variable is whether or not the person develops AIDS.In this unit, we have covered six specific tests, listed below. For each situation given in identify which of these tests is most appropriate. If multiple
Data are collected from 50 different towns on number of wood-burning houses and number of people with asthma, and the study is investigating whether there is a linear relationship between the two.In this unit, we have covered six specific tests, listed below. For each situation given in identify
The admissions office at a university uses data from high school transcripts such as number of honors courses, number of AP courses, grade in 11th grade English, and grade in 9th grade math to develop a model to predict success in college as measured by grade point average. They wish to test the
A polling agency working in a large city knows (from census data) the distribution of all city residents by race. They select a sample of 2000 residents and would like to check that the distribution of racial groups within their sample is not significantly different from the proportions in the city
A breakfast cereal company wants to know how useful the height of the display for that brand is in the store, in a model predicting sales of the boxes of cereal based on height of the display, price of the cereal, width of the aisle in the store, and amount spent on advertising in that community.In
A hockey team wants to determine how effective a model is to predict winning percentage based on power-play percentage, penalty-kill percentage, number of checks per game, face-off win percentage, and number of penalties per game.In this unit, we have covered six specific tests, listed below. For
A test is being conducted to see if the average time it takes for a case to go to trial differs between counties in a state. Seven counties will be included and the data will include a random sample of 25 cases from each county.In this unit, we have covered six specific tests, listed below. For
A test is being conducted to see if the proportion of cases that get settled out of court is different between the different counties in a state. Seven counties will be included and the data will include a random sample of 60 cases from each county.In this unit, we have covered six specific tests,
A Survey USA poll conducted March 16 to 20, 2012 on a random sample of 358 North Carolina likely Republican primary voters found that 38.5% preferred Rick Santorum, 29.6% preferred Mitt Romney, 20.4% preferred Newt Gingrich, and 11.5% preferred Ron Paul. Is this evidence that the candidates are not
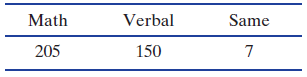
One of the variables in our StudentSurvey dataset is a categorical variable indicating in which SAT subject the student scored higher (Math, Verbal, or the same). The results are in Table D.11. Perform the appropriate test to determine if the overall number of intro stat students who scored higher
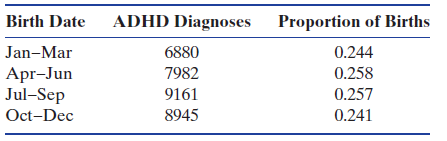
Table D.12 shows the number of boys diagnosed with ADHD based on the quarter of the year in which they were born, as well as the proportion of boys born during that quarter.Table D.12(a) What is the total number of boys diagnosed with ADHD in the sample?(b) For the null hypothesis, use the overall
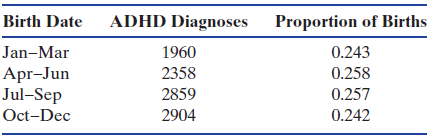
Exercise D.30 examines a relationship between relative age in a class and likelihood of ADHD diagnosis for boys in British Columbia. Girls are less likely overall to be diagnosed with ADHD but does the same relationship exist with relative age in school? Table D.13 shows the number of girls
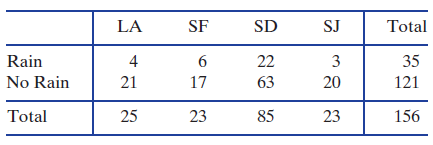
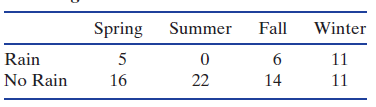
Amy is interested in moving to California but isn€™t certain which city she€™d prefer. One variable of interest to her is the proportion of rainy days in each city. She took a random sample of days from 2010 for each of the four biggest cities in California (Los Angeles, San
In Exercise D.32 we observe that within the random sample of 85 days the city of San Diego has rainy weather just over a quarter of the time. Amy is now curious as to whether there is a rainy season, or if the rainy days are dispersed evenly throughout the year. She separates the 85 days into the
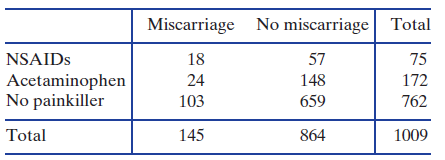
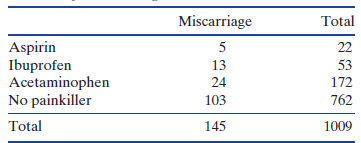
Exercise 2.22 on page 56 describes a study examining the link between miscarriage and the use of painkillers during pregnancy. Scientists interviewed 1009 women soon after they got positive results from pregnancy tests about their use of painkillers around the time of conception or in the early
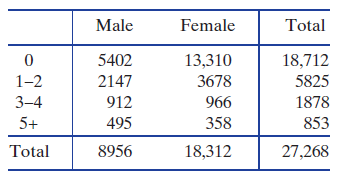
The American College Health Association€”National College Health Assessment survey, introduced on page 58, was administered at 44 colleges and universities in Fall 2011 with more than 27,000 students participated in the survey. Students in the ACHA€”NCHA survey were asked
The Sleep-Study dataset introduced in Data D.1 on page 599 contains many variables measuring different characteristics of the students in the study. One of these is a Happiness score that includes values from a minimum of 0 (very unhappy) to a maximum of 35 (extremely happy!). Find a reasonable
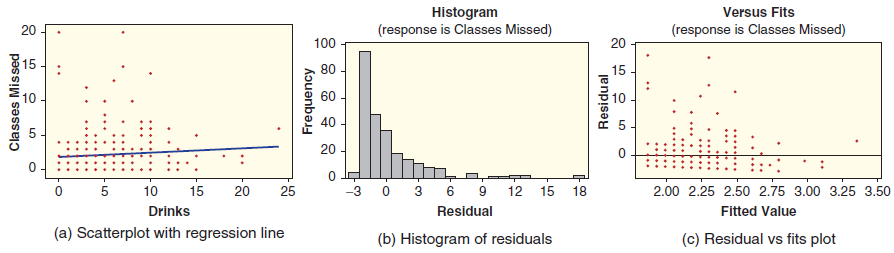
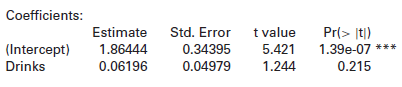
In Exercise D.47, we consider a regression model to use the number of alcoholic drinks a student has in a week to predict the number of classes missed in a semester. Here we check the conditions for using that regression model. Three graphs for this model are shown in Figure D.6: the scatterplot
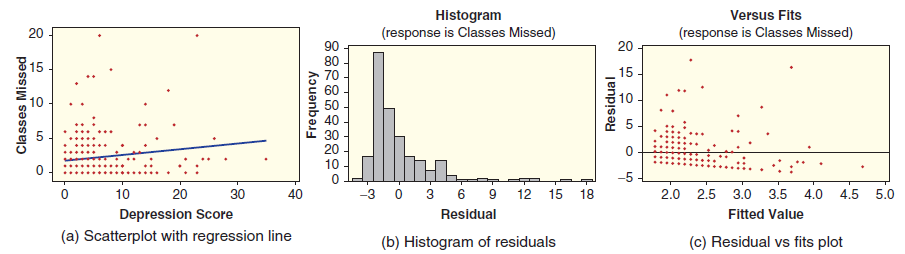
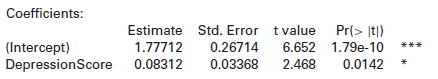
In Exercise D.46, we consider a regression model to use a student€™s depression score to predict the number of classes missed in a semester. Here we check the conditions for using that regression model. Three graphs for this model are shown in Figure D.5: the scatterplot with regression
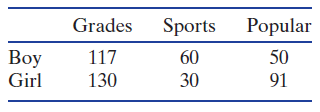
478 middle school (grades 4 to 6) students from three school districts in Michigan were asked whether good grades, athletic ability, or popularity was most important to them. The resultsare shown below, broken down by gender:(a) Do these data provide evidence that grades, sports, and popularity are
In Exercise C.64 on page 454, we looked at differences in average housing price between two states at a time with data from Homes- ForSale. We can now set up an ANOVA to test and see if there is a difference between all four states at once. We have a total of n = 120 homes from the k = 4 states.(a)
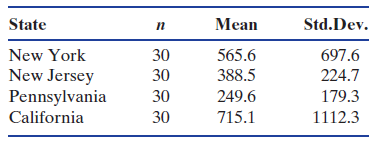
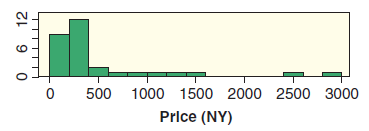
In Exercise D.37 we outline and discuss an ANOVA approach to test for a difference in average housing price between all four states using the dataset HomesForSale. Figure D.4 shows one of the samples, specifically for New York, and Table D.18 shows the mean and standard deviation for each of the
Data 9.2 on page 540 introduces the dataset Cereal, which includes information on the number of grams of fiber in a serving for 30 different breakfast cereals. The cereals come from three different companies: General Mills, Kellogg’s, and Quaker. Use the fact that SSGroups is 4.96 and SSTotal is
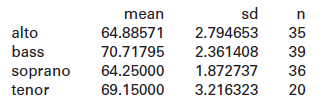
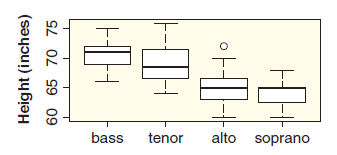
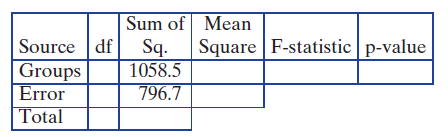
Data were collected on the heights of singers and are summarized and displayed below. Does average height differ by voice?(a) State the null and alternative hypotheses.(b) Are the conditions for using the F-distribution satisfied? Why or why not?(c) Complete the ANOVA table given below, and make a
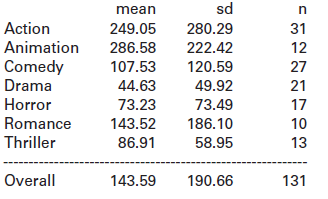
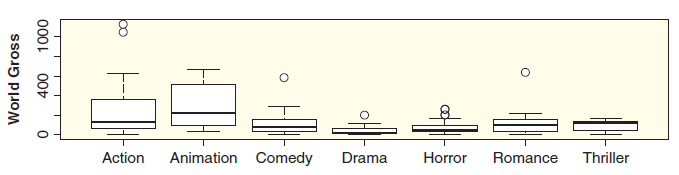
Gross We have data in HollywoodMovies2011 on the world gross (total worldwide box office income) for all 2011 Hollywood movies, although for this problem we€™ve removed movies classified as €˜€˜Adventure€ or €˜€˜Fantasy€
In Exercise 8.16 on page 506, we discuss a study investigating the effect of ink color on performance in an anagram test. Three different colors were used with a total of 71 participants. The red group contained 19 participants and they correctly solved an average of 4.4 anagrams. The 27
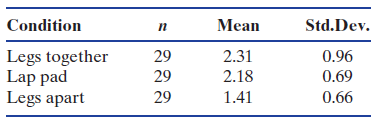
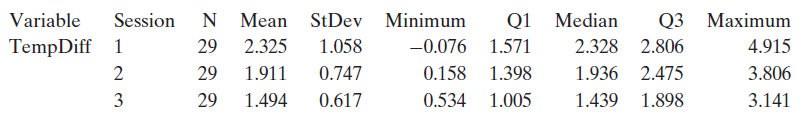
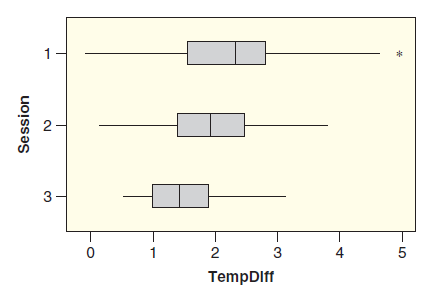
In Exercise 8.17 on page 507, we conduct an ANOVA test to see if mean scrotal temperature increase is different between three different conditions. In each condition, males sit with a laptop computer on the lap. In one condition, they sit with legs together, in another with legs apart, and in a
How closely related are results on short cognitive skills tests and a grade point average over several years in college? In Data D.1 on page 599, we introduce the data in SleepStudy. Two of the variables in that study are Cognition Z score, which is a standardized z-score derived from multiple
Does a good night’s sleep make you happier? In Data D.1 on page 599, we introduce the data in SleepStudy. Two of the variables in that study are Happiness, scores on a standard happiness scale with higher numbers indicating greater happiness, and AverageSleep, average number of hours slept in a
Is depression a possible factor in students missing classes? In Data D.1 on page 599, we introduce the data in SleepStudy. Two of the variables in that study are DepressionScore, scores on a standard depression scale with higher numbers indicating greater depression, and ClassesMissed, the number
Is drinking alcohol a possible factor in students missing classes? In Data D.1 on page 599, we introduce the data in SleepStudy. Two of the variables in that study are Drinks, the number of alcoholic drinks in a week, and ClassesMissed, the number of classes missed during the semester. Computer
The intervals given are for a player who makes 100 free throws in a season:Using the data in NBAPlayers2011, we can create a regression model to predict points in a season for an NBA basketball player based on the number of free throws made. For our sample data, the number of free throws made in a
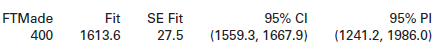
The intervals given are for a player who makes 400 free throws in a season:Using the data in NBAPlayers2011, we can create a regression model to predict points in a season for an NBA basketball player based on the number of free throws made. For our sample data, the number of free throws made in a
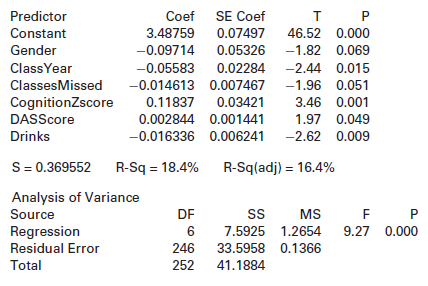
The computer output below shows a multiple regression model to predict grade point average (GPA) using six variables from the dataset SleepStudy. Gender is coded 0 for females and 1 for males; ClassYear is coded 1 for first year, 2 for sophomore, 3 for junior, and 4 for senior; ClassesMissed is
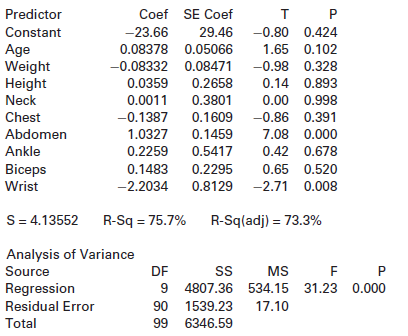
Data 10.1 on page 562 introduces the dataset BodyFat. Computer output is shown for using this sample to create a multiple regression model to predict percent body fat using the other nine variables.The regression equation is Bodyfat = ˆ’ 23.7 + 0.0838 Age ˆ’ 0.0833 Weight +
The dataset StudentSurvey, introduced on page 4, contains information on hours of Exercise per week and GPA. Here we use a slightly modified version called GPAGender which eliminates missing values (leaving n = 343 students) and codes the gender with 1 for males and 0 for females in a new
The dataset GPAGender, described in Exercise D.54, contains a subset of the StudentSurvey data which also has information on totalSAT scores, GPA, and number of Piercings for those n = 343 students.(a) Test for an association between number of Piercings and GPA using the data in GPAGender. Give the
Exercise D.53 shows a multiple regression model to predict percent body fat using the nine other variables in the dataset BodyFat. Try to improve on this model, using a subset of these predictors to balance the desire to use important individual predictors with explaining a significant portion of
The dataset BaseballHits has a variable called Wins for the number of wins in a season and also has many other quantitative variables: Runs, Hits, Doubles, Triples, HomeRuns, RBI, StolenBases, Caught-Stealing, Walks, StrikeOuts, BattingAverage. Use technology and this dataset to find a good model
Athletes routinely swipe black grease under their eyes to help cut down on glare on sunny days. Recently, some athletes have switched from grease to patches of black tape. Does either method work? Which is best? A recent study helped to answer these questions. A sample of 46 subjects were tested
In Data 1.3 on page 10, we describe a 10-year study in which scientists investigated the effect of tagging penguins with either a metal strip or an electronic tag. In the study, a sample of 100 penguins were randomly assigned to one of the two groups and then followed for 10 years. The study found
In a study investigating how students use their laptop computers in class, researchers recruited 45 students at one university in the Northeast who regularly take their laptops to class. Software was installed on each of their computers that logged information on the applications the computer was
A study described in Data A.1 on page 136 found that mice exposed to dim light at night gained substantially more weight than mice that had complete darkness at night, despite the fact that calorie intake and activity levels were the same for the two groups. Was it the light that caused the mice to
Data A.1 on page 136 and the followup study described in Exercise A.4 imply that mice that eat when they should normally be sleeping gain significantly more weight than mice that eat at the usual time. This is consistent with other studies showing that nighttime eating by people can foster weight
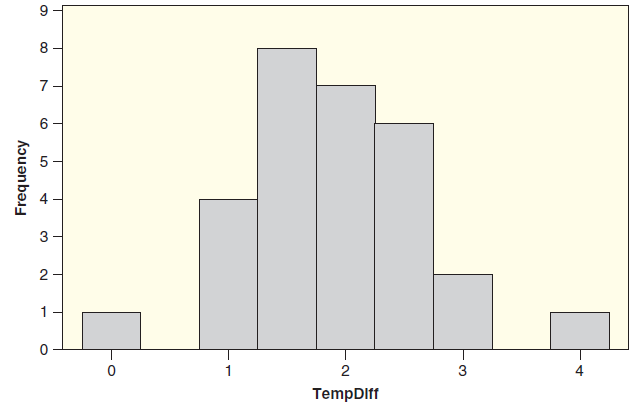
In Exercise 2.101 on page 87, we discuss a study about the effect of heat from laptop computers on scrotum temperature in men. Heating the scrotum by just 1—¦C can reduce sperm count and quality, and repeated increases in temperature can have a longterm effect. In a new study,
Eighty-six patients with bladder cancer participated in a study in which all tumors were removed and then the subjects were monitored to see if the tumors returned. Patients were randomly assigned to one of two treatment groups: one group received a placebo and one group received the drug thiotepa.
Data 2.12 on page 119 introduces a dataset containing information on customers€™ tipping patterns in a restaurant. The data are available in Restaurant- Tips.(a) What are the cases? What is the sample size?(b) What are the variables? Identify each variable as quantitative or
The results of a student survey were introduced in Data 1.1 on page 4. Is the dataset from a sample or a population? If it is from a sample, describe a relevant population to which we might make inferences.
Data 2.3 on page 66 introduced the dataset ICU-Admissions, which contains 20 different variables recorded for 200 patients admitted to the Intensive Care Unit at a hospital.(a) What is the sample? What is a reasonable population?(b) Indicate which variables are quantitative.(c) List at least two
A Dutch study implies that exercising before eating protein might help the body convert more of the protein into muscle. In the study, 48 men were randomly assigned to either exercise or rest for 30 minutes. At the end of the 30 minutes, all drank a protein shake and had their muscle-protein
In 2000, a study was conducted on 4000 Swedish 15-year-old males. The boys were surveyed and asked, among other things, how often they consume fish each week. Three years later, these answers were linked to the boys’ scores as 18-year-olds on an intelligence test. The study found that boys who
In an introductory statistics class in which regular quizzes are given, should the first quiz be easy (to give students confidence) or hard (to convince students to work harder)? The response variable will be grades on a later exam that is common to all students.(a) Describe an observational study
The title of this exercise was a recent headline. The article goes on to describe a study in which men’s walking speeds at age 70 were measured and then the men were followed over several years. In the study, men who walked slowly were more likely to die. The article concludes that ‘‘Men can
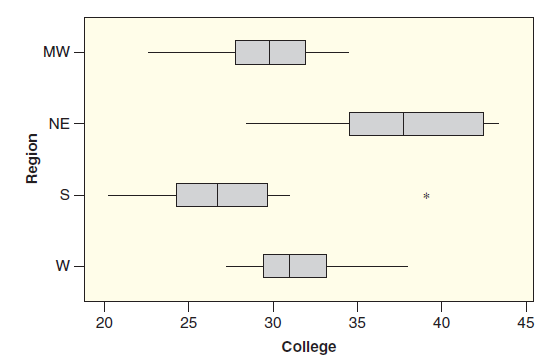
The dataset US States includes information on the percent of the population to graduate from college (of those age 25 and older) for each US state. Figure A.7 shows side-by-side boxplots for percent of college graduates by region of the country (Midwest, Northeast, South, and West.)Figure A.7(a)
If you want people to agree with you, get them to join you in a line dance or to march in lock-step with you. A recent study shows that we feel more emotionally connected to one another when we’re moving in sync. In the study, researchers asked 70 college students to walk behind an accomplice
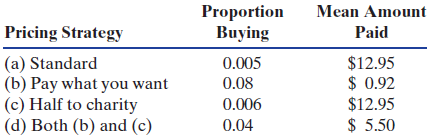
An experiment on pricing and social responsibility was conducted using a popular ride at a large amusement park, where digital photos are taken of the riders and offered for sale at the end of the ride. The experiment was designed to determine the effect of pricing strategy under four conditions:
Frazer Computing, a company that leases software, has over 8000 used car dealer customers. The company wants to contact 10 of these car dealers, randomly selected, to conduct in-depth interviews on how the software is meeting their needs. Suppose the car dealers are numbered 1 to 8000. Use a random
Over 30,000 people participated in an online poll on cnn.com asking ‘‘Have you ever driven with a pet on your lap?” The results show that 34% answered yes and 66% answered no. Can we conclude that 34% of all people have driven with a pet on their lap? Can we conclude that 34% of all
Scientists came up with a clever way to test whether the physical act of smiling increases positive emotions. They randomly divided participants into two groups of 24 each. The ‘‘smiling” group was asked to hold a pencil between their teeth (which forces the face into a smile), while the
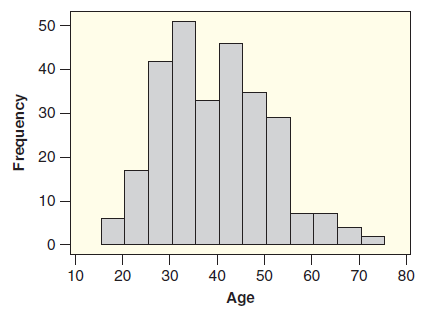
Figure A.8 shows a histogram of the ages of n = 279 patients being treated for back pain. Estimate the mean and standard deviation of the ages of back pain patients.Figure A.8 50 40 – 30 - 10 10 20 30 40 50 60 70 80 Age Frequency 20
Is lie detection software accurate? A recent study was conducted in order to test the accuracy of a commonly used method of lie detection. The researchers are specifically interested in how lie detectors perform when an individual is stressed. A sample of 48 participants were gathered and attached
Exercise A.23 describes a study in which lie detector accuracy is checked by having participants read deceptive material. In addition to deceptive material, the individuals were also asked to read truthful material. The electric shock was again included to add stress. The lie detector accurately
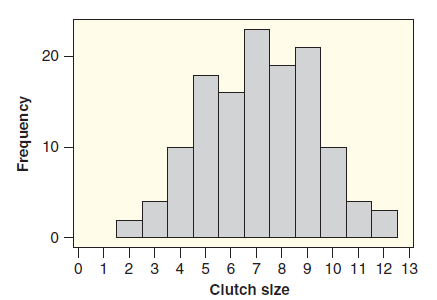
A naturalist counts the number of baby birds, or clutch size, in a sample of 130 different nests. A histogram of her results is shown in Figure A.9. Is the distribution approximately symmetric and bell-shaped? Estimate the mean of the clutch sizes. Estimate the standard deviation of the clutch
A sample of 30 men were given the PSA (prostate specific antigen) test to screen for prostate cancer. For the 30 values obtained, the median score wasm = 3 and the mean was x̅ = 11. Explain how it is possible for the mean and the median to be so different. What is likely to be true about the shape
The number of consecutive frost-free days in a year is called the growing season. A farmer considering moving to a new region finds that the median growing season for the area for the last 50 years is 275 days while the mean growing season is 240 days.(a) Explain how it is possible for the mean to
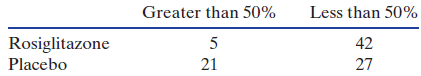
Rosiglitazone is normally prescribed to control blood sugar in people with Type II diabetes, but it may also provide a benefit to heart patients. A study identified 95 people with Type II diabetes who were undergoing angioplasty to open coronary arteries. For six months after the angioplasty, about
A survey of n = 1917 cell phone users in May 2010 asked ‘‘On an average day, about how many phone calls do you make and receive on your cell phone?” The results are displayed in Table A.5.Number of Calls ..........Percentage0 ............................................5%1–5
The drug finasteride is marketed as Propecia to help protect against male pattern baldness, and it also may protect against prostate cancer. A large sample of healthy men over age 55 were randomly assigned to receive either a daily finasteride pill or a placebo. The study lasted seven years and the
(a) Do you expect the distribution of the lengths of all phone calls made on a cell phone during one month to be symmetric, skewed to the right, or skewed to the left?(b) Two measures of center for this distribution are 2.5 minutes and 13.7 minutes. Which is most likely to be the mean and which is
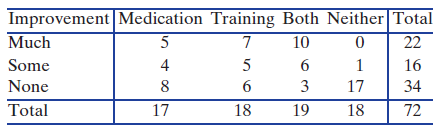
Studies have shown that behavioral changes and prescription medication can help older people fight insomnia. Researchers followed the sleep patterns of 72 people whose average age was 65. Seventeen people took a medication called temazepam an hour before bedtime, 18 people received training in
Many kidney dialysis patients get vitamin D injections to correct for a lack of calcium. Two forms of vitamin D injections are used: calcitriol and paricalcitol. In the first study to compare survival rates of patients getting one drug or the other, the records of 67,000 dialysis patients were
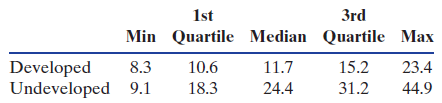
Is the birth rate different in developed and undeveloped countries? In the dataset AllCountries, we have information on the birth rate of all 213 countries as well as an indicator for whether the country is considered a developed or undeveloped nation. Use the five number summaries for each group
(a) Draw a boxplot for data that illustrate a distribution skewed to the right.(b) Draw a boxplot for data that illustrate a distribution skewed to the left.(c) Draw a boxplot for data that illustrate a symmetric distribution.
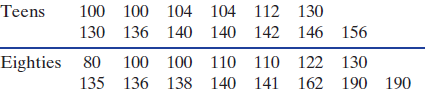
How does the variability in systolic blood pressure compare between ICU patients in their teens and those in their eighties for the patients in the dataset ICUAdmissions? The values for each group are given in Table A.8. Use technology to find the five number summary, the range and IQR, and the
Are any of the systolic blood pressures in Exercise A.36 for patients in their teens or eighties outliers within their group? Justify your answer.
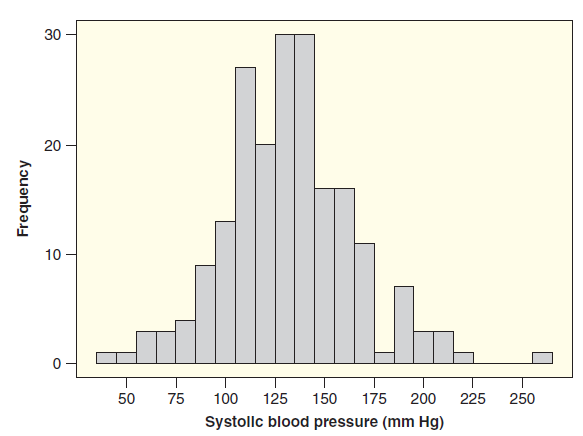
Figure A.10 shows a histogram of the systolic blood pressure (in mm Hg) for all 200 patients admitted to the Intensive Care Unit, from the ICUAdmissions dataset. The mean and standard deviation of these 200 numbers are xÌ… = 132.28 and s = 32.95.Figure A.10(a) Is it appropriate to use
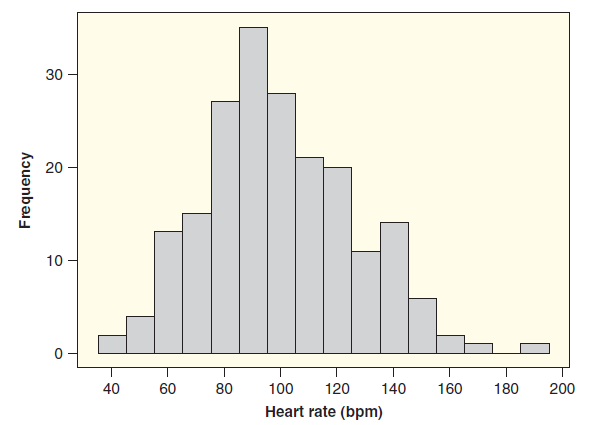
Figure A.11 shows a histogram of the heart rate data, in beats per minute, from ICUAdmissions. The values come from n = 200 patients being admitted to the Intensive Care Unit at a hospital.Figure A.11(a) Estimate the mean and the standard deviation.(b) Estimate the 10th percentile and interpret
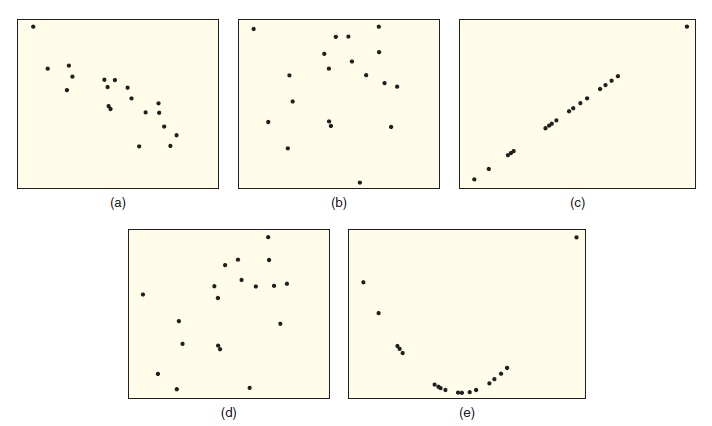
Give a rough estimate of the correlation r for each of the scatterplots shown inFigure A.12. .... (a) (c) (d) (e)
A random sample of seven statistics students were taken from the StudentSurvey dataset. The Math and Verbal SAT scores for the seven students are shown in Table A.9. We are interested in predicting scores on the verbal section using scores on the math section.Table A.9Math ................Verbal720
Association? In each case, decide whether the relationship between the variables is more likely to be positive or negative. In the cases where it makes sense to view one variable as an explanatory variable and the other as the response variable, identify which is which.(a) Number of years spent
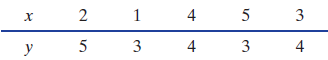
For the five data points in Table A.10:Table A.10(a) Make a scatterplot of the data.(b) Use technology to find the correlation.(c) Make a new scatterplot showing these five data points together with an additional data point at (10, 10).(d) Use technology to find the correlation for this larger
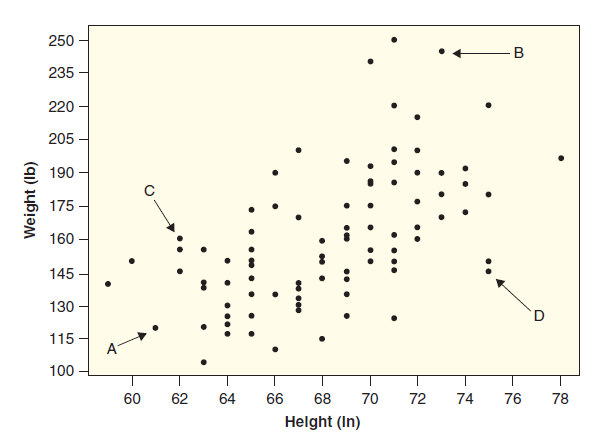
Figure A.13 shows a scatterplot of height and weight for a new sample of 105 college students.Figure A.13(a) Does there appear to be a positive or a negative relationship in the data?(b) Describe the body shape of the individuals whose points are labeled by A, B, C, and D. 250 -B 235 220 205 190
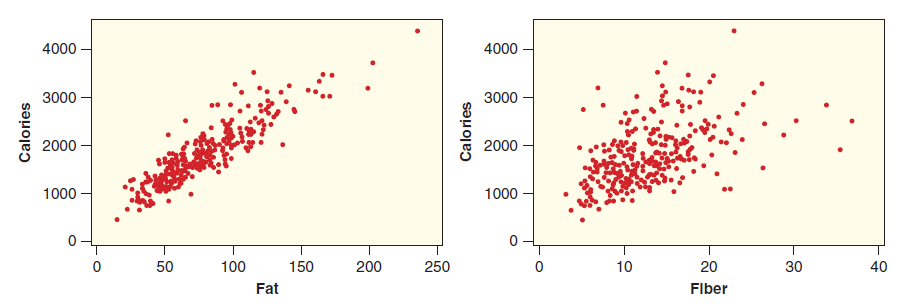
The dataset NutritionStudy contains information on daily calorie consumption, fat consumption, and fiber consumption for 315 healthy individuals. Figure A.14 shows a scatterplot of fat vs calories and a scatterplot of fiber vs calories. (In these figures, we have omitted one extreme outlier.)Figure
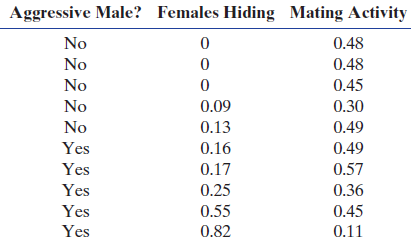
If a male wants mating success, he should not hang out with hyper-aggressive males. They tend to scare away all the females. At least, that is the message from a study on water striders. Water striders are common bugs that skate across the surface of water. Water striders have different
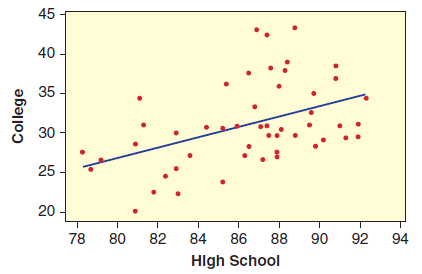
Exercise A.16 on page 145 used data in the USStates dataset to examine the percent of adults to graduate college in US states by region. The dataset also includes information on the percent to graduate high school in each state. We use the percent to graduate high school to predict the percent to
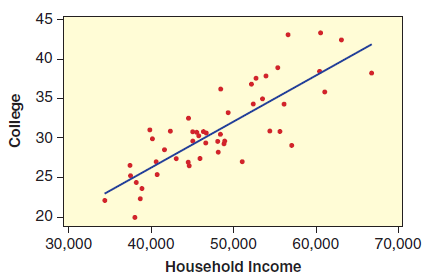
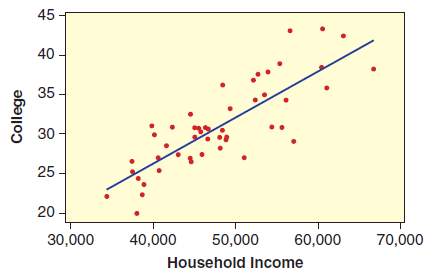
In Exercise A.47, we used the percent of the population graduating high school to predict the percent to graduate college, using data in US States. It is likely that the mean household income in the state might also be a reasonable predictor. Figure A.16 shows a scatterplot with regression line for
The dataset NBAPlayers2011 is introduced on page 88, and includes many variables about players in the National Basketball Association in 2010–2011. In this exercise, we’ll use FTPct, the percent of free throws made, to predict FGPct, the percent of field goals made.(a) Make a scatterplot of
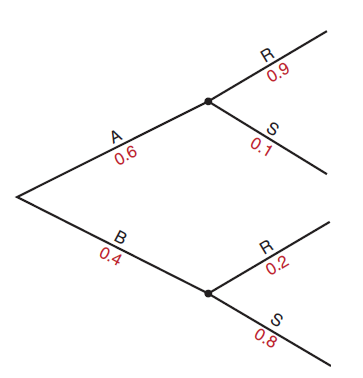
P(R)Find the requested probabilities using the tree diagram in Figure 11.4. 0.9 A 0.1 0.6 0.4 0.2 0.8
P(S if B)Find the requested probabilities using the tree diagram in Figure 11.4. 0.9 A 0.1 0.6 0.4 0.2 0.8
P(R if A)Find the requested probabilities using the tree diagram in Figure 11.4. 0.9 A 0.1 0.6 0.4 0.2 0.8
P(A and S)Find the requested probabilities using the tree diagram in Figure 11.4. 0.9 A 0.1 0.6 0.4 0.2 0.8
P(B and R)Find the requested probabilities using the tree diagram in Figure 11.4. 0.9 A 0.1 0.6 0.4 0.2 0.8
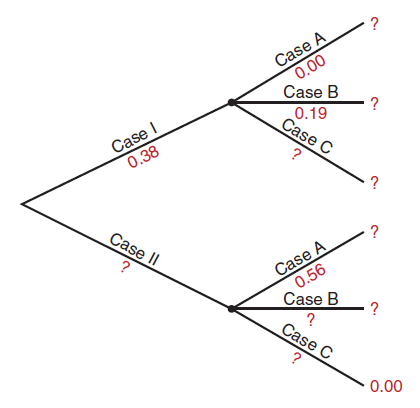
Complete each tree diagram by filling in the missing entries (marked with a €˜€˜?€). ? Case A 0.00 Case B Case I 0.38 0.19 Case C Case II Case A 0.56 Case B Case C 0.00
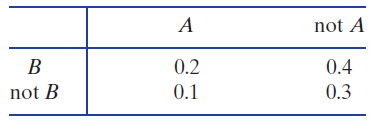
Are events A and B disjoint?Table 11.3 gives probabilities for various combinations of events A, B, and their complements.Table 11.3 not A 0.4 B 0.2 not B 0.1 0.3
Find P(not B).Use the information that, for events A and B, we have P(A) = 0.8, P(B) = 0.4, and P(A and B) = 0.25.
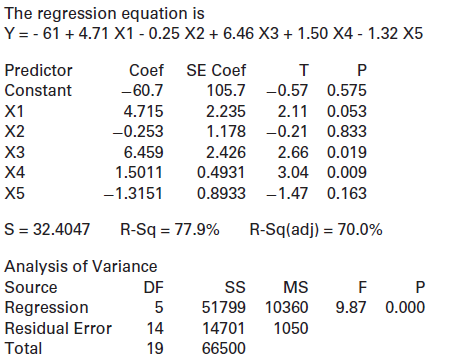
What are the explanatory variables? What is the response variable?Refer to the multiple regression output shown: The regression equation is Y = - 61 + 4.71 X1 - 0.25 X2 + 6.46 X3 + 1.50 X4 - 1.32 X5 Predictor Coef SE Coef т Constant -60.7 105.7 -0.57 0.575 X1 4.715 2.235 2.11 0.053 X2 -0.253 1.178
Find P(not B).Use the information that, for events A and B, we have P(A) = 0.4, P(B) = 0.3, and P(A and B) = 0.1.
Find P(A or B).Use the information that, for events A and B, we have P(A) = 0.4, P(B) = 0.3, and P(A and B) = 0.1.
Find P(A if B).Use the information that, for events A and B, we have P(A) = 0.4, P(B) = 0.3, and P(A and B) = 0.1.
Find P(B if A).Use the information that, for events A and B, we have P(A) = 0.4, P(B) = 0.3, and P(A and B) = 0.1.
Showing 200 - 300
of 2108
1
2
3
4
5
6
7
8
9
10
11
12
13
14
15
Last
Step by Step Answers