New Semester
Started
Get
50% OFF
Study Help!
--h --m --s
Claim Now
Question Answers
Textbooks
Find textbooks, questions and answers
Oops, something went wrong!
Change your search query and then try again
S
Books
FREE
Study Help
Expert Questions
Accounting
General Management
Mathematics
Finance
Organizational Behaviour
Law
Physics
Operating System
Management Leadership
Sociology
Programming
Marketing
Database
Computer Network
Economics
Textbooks Solutions
Accounting
Managerial Accounting
Management Leadership
Cost Accounting
Statistics
Business Law
Corporate Finance
Finance
Economics
Auditing
Tutors
Online Tutors
Find a Tutor
Hire a Tutor
Become a Tutor
AI Tutor
AI Study Planner
NEW
Sell Books
Search
Search
Sign In
Register
study help
engineering
control systems engineering
Control Systems Engineering 7th Edition Norman S. Nise - Solutions
Assume that the car motive dynamics for a hybrid electric vehicle (HEV) can be described by the transfer functionwhere AV is the change of velocity in m/sec and ΔFe is the change in excess motive force in N necessary to propel the vehicle.a. Find an analytical expression for Δv(t) for a step
Name three basic forms for interconnecting subsystems.
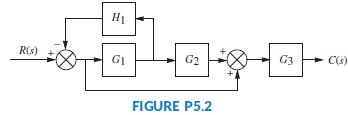
Find the closed-loop transfer function, T(s) = C(s)/R(s) for the system shown in Figure P5.2, using block diagram reduction. H1 R(s) GI G2 C3 C(s) FIGURE P5.2
For each of the forms in Question 2, state (respectively) how the equivalent transfer function is found.Data From Question 2:Name three basic forms for interconnecting subsystems.
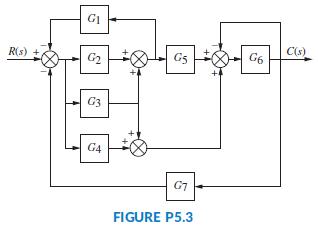
Find the equivalent transfer function, T(s) = C(s)/R(s), for the system shown in Figure P5.3. G1 R(s) + G5 G6 C(s) G2 G3 G4 G7 FIGURE P5.3
Besides knowing the basic forms as discussed in Questions 2 and 3, what other equivalents must you know in order to perform block diagram reduction?Data From Question 2:Name three basic forms for interconnecting subsystems.Data From Question 3:For each of the forms in Question 2, state
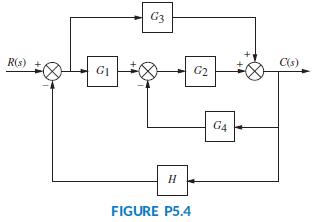
Reduce the system shown in Figure P5.4 to a single transfer function, T(s) = C(s)/R(s). G3 R(s) C(s) G1 G2 G4 FIGURE P5.4
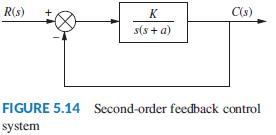
For a simple, second-order feedback control system of the type shown in Figure 5.14, describe the effect that variations of forward-path gain, K, have on the transient response. R(s) K C(s) s(s + a) FIGURE 5.14 Second-order feedback control system
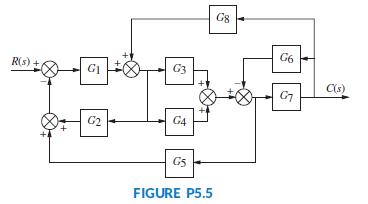
Find the transfer function, T(s) = C(s)/R(s), for the system shown in Figure P5.5. Use the following methods:a. Block diagram reductionb. MATLAB. Use the following transfer functions:G1(s) = 1/(s + 7); G2(s) = 1/(s2 + 2s + 3),G3(s) = 1/(s + 4); G4(s) = 1/s,G5(s) = 5/(s + 7); G6(s) = 1/(s2 + 5s +
For a simple, second-order feedback control system of the type shown in Figure 5.14, describe the changes in damping ratio as the gain, K, is increased over the underdamped region. R(s) K C(s) s(s + a) FIGURE 5.14 Second-order feedback control system
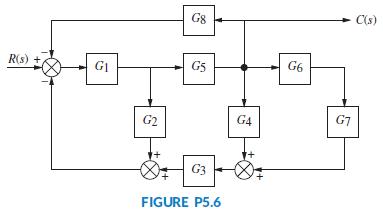
Reduce the block diagram shown in Figure P5.6 to a single block, T(s) = C(s)/R(s). G8 C(s) R(s) G1 G5 G6 G2 G4 G7 G3 FIGURE P5.6
Name the two components of a signal-flow graph.
How are summing junctions shown on a signal-flow graph?
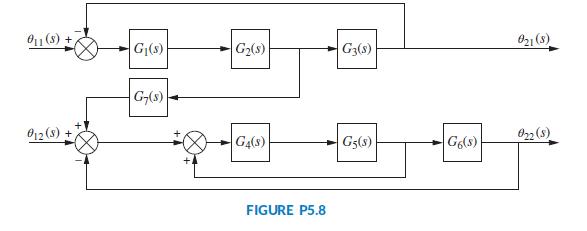
Given the block diagram of a system shown in Figure P5.8, find the transfer function G(s) = θ22(s)/θ11(s). O1 (s) +7 021 (s) G|(s) G2(s) G3(8) G-(s) O12 (s) + O22 (s) G4(s) G5(3) G6(s) FIGURE P5.8
If a forward path touched all closed loops, what would be the value of Δk?
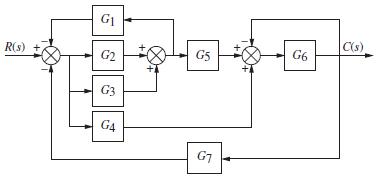
Reduce the block diagram shown in Figure P5.9 to a single transfer function, T(s) = C(s)/R(s).Figure P5.9 G1 C(s) R(s) G2 G5 G6 G3 G4 G7
Name five representations of systems in state space.
Which two forms of the state-space representation are found using the same method?
For the system shown in Figure P5.11, find the percent overshoot, settling time, and peak time for a step input if the system’s response is underdamped. (Is it? Why?) R(s) E(s) 225 C(s) s(s + 15) FIGURE P5.11
Which form of the state-space representation leads to a diagonal matrix?
The real part of a pole generates what part of a response?
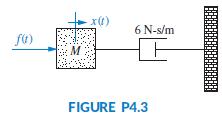
For the system shown in Figure P4.3, (a) find an equation that relates settling time of the velocity of the mass to M; (b) find an equation that relates rise time of the velocity of the mass to M. x(1) 6 N-s/m M FIGURE P4.3
What is the difference between the natural frequency and the damped frequency of oscillation?
Plot the step response for Problem 6 using MATLAB. From your plots, find the time constant, rise time, and settling time. Use M = 1 and M = 2.Data From Problem 6:For the system shown in Figure P4.3, (a) find an equation that relates settling time of the velocity of the mass to M; (b) find an
If a pole is moved with a constant imaginary part, what will the responses have in common?
If a pole is moved with a constant real part, what will the responses have in common?
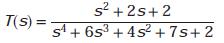
Use MATLAB to find the poles of 2s+2 T(s) = s4 + 6s3 + 4s2 +7s+2
If a pole is moved along a radial line extending from the origin, what will the responses have in common?
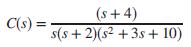
For the following response functions, determine if pole zero cancellation can be approximated. If it can, find percent overshoot, settling time, rise time, and peak time.a.b.c.d. (s+4) C(s) = s(s + 2)(s2 + 3s + 10)
Using MATLAB, plot the time response of Problem 33a and from the plot determine percent overshoot, settling time, rise time, and peak time.Data from Problem 33a: (s+4) C(s) = s(s + 2)(s2 + 3s + 10)
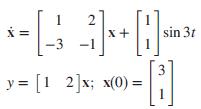
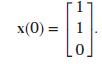
Given the following state-space representation of a system, find Y(s): 1 x + sin 3t -3 3. y = [1 2]x; x(0) = %3D
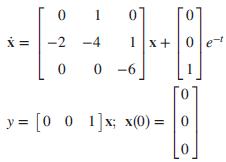
Given the following system represented in state space, solve for Y(s) using the Laplace transform method for solution of the state equation: -2 -4 1 x+ |0 0 e- 0 -6 y = [0 0 1]x; x(0) =
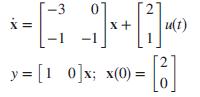
Solve the following state equation and output equation for y(t), where u(t) is the unit step. Use the Laplace transform method. -3 x+ u(t) -1 y = [1 0]x; x(0) =
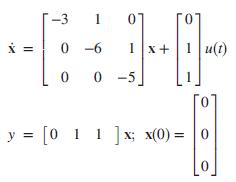
Solve for y(t) for the following system represented in state space, where u(t) is the unit step. Use the Laplace transform approach to solve the state equation. -3 1 01 X = |0 -6 1 x+1 u(t) 0 0 -5 y = [0 1 1 ]x; x(0) =
Use MATLAB to plot the step response of Problem 43.Data From Problem 43:Solve for y(t) for the following system represented in state space, where u(t) is the unit step. Use the Laplace transform approach to solve the state equation. -3 1 01 X = |0 -6 1 x+1 u(t) 0 0 -5 y = [0 1 1 ]x; x(0) =
Repeat Problem 43 using MATLAB’s Symbolic Math Toolbox and Eq. (4.96). In addition, run your program with an initial condition,Data From Problem 43:Solve for y(t) for the following system represented in state space, where u(t) is the unit step. Use the Laplace transform approach to solve the
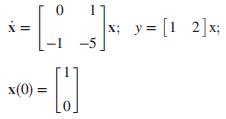
Using classical (not Laplace) methods only, solve for the state-transition matrix, the state vector, and the output of the system represented here. x; y= [1 2]x; -1 -5 x(0) =
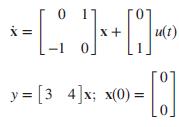
Using classical (not Laplace) methods only, solve for the state-transition matrix, the state vector, and the output of the system represented here, where u(t) is the unit step: u(t) -1 0 0. y = [3 4]x; x(0) = Lo]
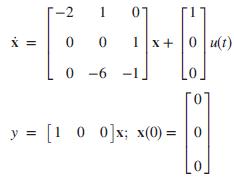
Solve for y(t) for the following system represented in state space, where u(t) is the unit step. Use the classical approach to solve the state equation. --2 1 X = 0 0 1 x+ 0 u(t) 0 -6 -1. Lo. y = [1 0 0]x; x(0) =
Repeat Problem 48 using MATLAB’s Symbolic Math Toolbox and Eq (4.109). In addition, run your program with an initial condition,Data from Problem 48:Solve for y(t) for the following system represented in state space, where u(t) is the unit step. Use the classical approach to solve the state
Using methods described in Appendix H.1located at www.wiley.com/college/nise, simulate the following system and plot the step response. Verify the expected values of percent overshoot, peak time, and settling time. 1 T(s) = + 0.8s + 1
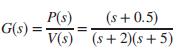
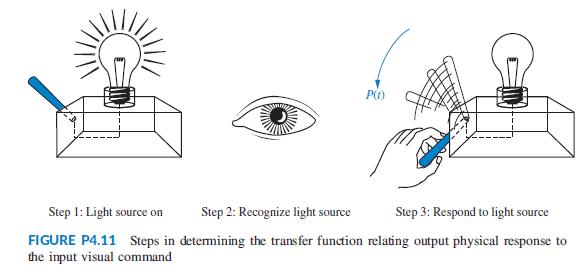
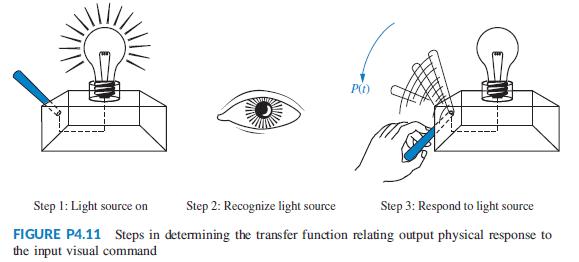
A human responds to a visual cue with a physical response, as shown in Figure P 4.11. The transfer function that relates the output physical response, P(s), to the input visual command, V(s), is (Stefani, 1973).Do the following:a. Evaluate the output response for a unit step input using the Laplace
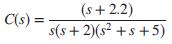
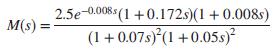
Upper motor neuron disorder patients can benefit and regain useful function through the use of functional neuro prostheses. The design requires a good understanding of muscle dynamics. In an experiment to determine muscle responses, the identified transfer function was (Zhou, 1995)Find the unit
When electrodes are attached to the mastoid bones (right behind the ears) and current pulses are applied, a person will sway forward and backward. It has been found that the transfer function from the current to the subject’s angle (in degrees) with respect to the vertical is given by (Nashner,
A MOEMS (optical MEMS) is a MEMS (Micro Electromechanical Systems) with an optical fiber channel that takes light generated from a laser diode. It also has a photodetector that measures light intensity variations and outputs voltage variations proportional to small mechanical device deflections.
The response of the deflection of a fluid-filled catheter to changes in pressure can be modeled using a second-order model. Knowledge of the parameters of the model is important because in cardiovascular applications the undamped natural frequency should be close to five times the heart rate.
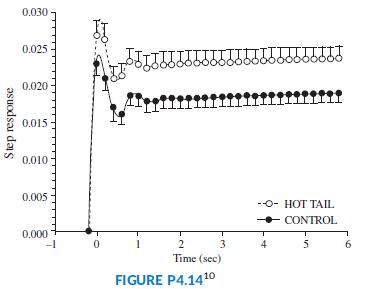
Several factors affect the workings of the kidneys. For example, Figure P4.14 shows how a step change in arterial flow pressure affects renal blood flow in rats. In the “hot tail” part of the experiment, peripheral thermal receptor stimulation is achieved by inserting the rat’s tail in heated
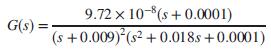
The transfer function of a nano-positioning device capable of translating biological samples within a few μm uses a piezoelectric actuator and a linear variable differential transformer (LDVT) as a displacement sensor. The transfer function frominput to displacement has been found to be (Salapaka,
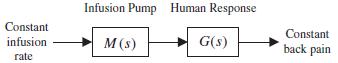
At some point in their lives most people will suffer from at least one onset of low back pain. This disorder can trigger excruciating pain and temporary disability, but its causes are hard to diagnose. It is well known that low back pain alters motor trunk patterns; thus it is of interest to study
An artificial heart works in closed loop by varying its pumping rate according to changes in signals from the recipient’s nervous system. For feedback compensation design it is important to know the heart’s open-loop transfer function. To identify this transfer function, an artificial heart is
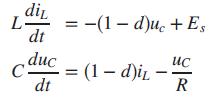
An observed transfer function from voltage potential to force in skeletal muscles is given by (Ionescu, 2005)a. Obtain the system’s impulse response.b. Integrate the impulse response to find the step response.c. Verify the result in Part b by obtaining the step response using Laplace transform
In typical conventional aircraft, longitudinal flight model linearization results in transfer functions with two pairs of complex conjugate poles. Consequently, the natural response for these airplanes has two modes in their natural response. The “short period” mode is relatively well damped
A cross lapper is a machine that takes as an input a light fiber fabric and produces a heavier fabric by laying the original fabric in layers rotated by 90 degrees. A feedback system is required in order to maintain consistent product width and thickness by controlling its carriage velocity. The
Although the use of fractional calculus in control systems is not new, in the last decade there is increased interest in its use for several reasons. The most relevant are that fractional calculus differential equations may model certain systems with higher accuracy than integer differential
Mathematical modeling and control of pH processes are quite challenging since the processes are highly nonlinear, due to the logarithmic relationship between the concentration of hydrogen ions [H+] and pH level. The transfer function from input pH to output pH iswhere we assume a delay of 3.3
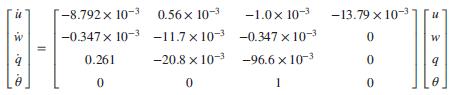
Using wind tunnel tests, insect flight dynamics can be studied in a very similar fashion to that of man-made aircraft. Linearized longitudinal flight equations for a bumblebee have been found in the unforced case to bewhere u= forward velocity; w= vertical velocity, q= angular pitch rate at center
A dc-dc converter is a device that takes as an input an unregulated dc voltage and provides a regulated dc voltage as its output. The output voltage may be lower (buck converter), higher (boost converter), or the same as the input voltage. Switching dc-dc converters have a semiconductor active
An IPMC (ionic polymer-metal composite) is a Nafion sheet plated with gold on both sides. An IPMC bends when an electric field is applied across its thickness. IPMCs have been used as robotic actuators in several applications and as active catheters in biomedical applications. With the aim of
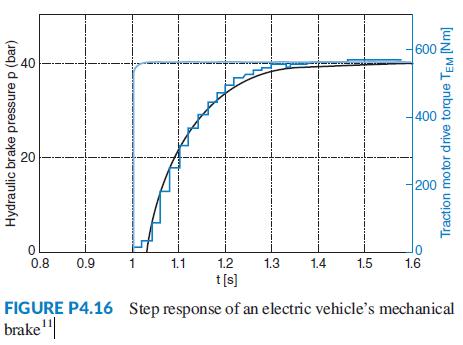
Figure P4.16 shows the step response of an electric vehicle’s mechanical brakes when the input is the drive torque (N-m) and the output is the hydraulic brake pressure (bar) (Ringdorfer, 2011).a. Find the transfer function of the system.b. Use the values of the parameters for the transfer
Figure P4.17 shows the free-body diagrams for planetary gear components used in the variable valve timing (VVT) system of an internal combustion engine (Ren, 2011). Here an electric motor is used to drive the carrier. Analysis showed that the electric motor with planetary gear load (Figure P4.17)
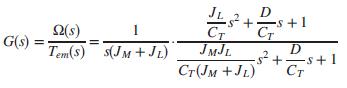
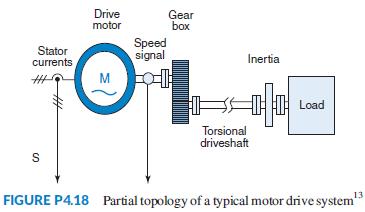
A drive system with elastically coupled load (Figure P4.18) has a motor that is connected to the load via a gearbox and a long shaft.The system parameters are: JM = drive-side inertia= 0.0338 kg-m2, JL = load-side inertia = 0.1287 kg-m2, K = CT = torsional spring constant = 1700 N-m/rad, and D =
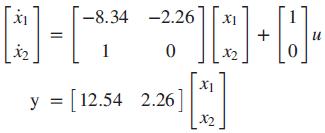
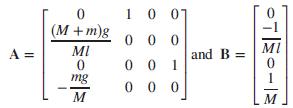
An inverted pendulum mounted on a motor-driven cart was presented in Problem 30 of Chapter 3. The nonlinear state-space equations representing that system were linearized (Prasad, 2012) around a stationary point corresponding to the pendulum point-mass, m, being in the upright position (x0 = 0 at t
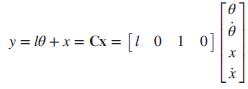
Find an equation that relates 2% settling time to the value of fv for the translational mechanical system shown in Figure P4.19. Neglect the mass of all components. f(). 2 N/m FIGURE P4.19
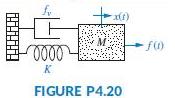
Consider the translational mechanical system shown in Figure P4.20. A 1-pound force, f(t), is applied at t = 0. If fv = 1, find K and M such that the response is characterized by a 4-second settling time and a 1 second peak time. Also, what is the resulting percent overshoot? fr f) K FIGURE P4.20
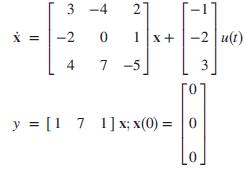
Find the transfer function and poles of the system represented in state space here. 3 -4 X = -2 1 x+-2 u(t) 7 -5 3 y = [1 7 7 1]x; x(0) = 0 %3D 2. 4.
List five specifications for a second-order underdamped system.
Repeat Problem 10 using MATLAB.Data From Problem 10:Find the transfer function and poles of the system represented in state space here. 3 -4 X = -2 1 x+-2 u(t) 7 -5 3 y = [1 7 7 1]x; x(0) = 0 %3D 2. 4.
For Question 11 how many specifications completely determine the response?Data From Question 11:List five specifications for a second-order underdamped system.
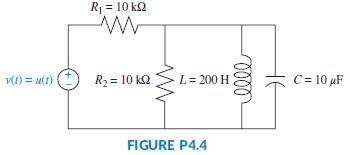
Write the general form of the capacitor voltage for the electrical network shown in Figure P4.4. R = 10 k2 vit) = u(t) R2 = 10 k2 C = 10 µF L= 200 H FIGURE P4.4
What pole locations characterize (1) the underdamped system, (2) the overdamped system, and (3) the critically damped system?
Use MATLAB to plot the capacitor voltage in Problem 12.Data from Problem 12:Write the general form of the capacitor voltage for the electrical network shown in Figure P4.4. R = 10 k2 vit) = u(t) R2 = 10 k2 C = 10 µF L= 200 H FIGURE P4.4
Name two conditions under which the response generated by a pole can be neglected.
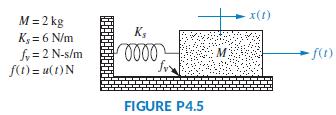
Solve for x(t) in the system shown in Figure P4.5 if f (t) is a unit step. x(t) M = 2 kg Ks K, = 6 N/m fy = 2 N-s/m f(1) = u(1)N 000 M f(t) FIGURE P4.5
How can you justify pole-zero cancellation?
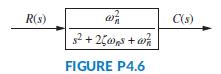
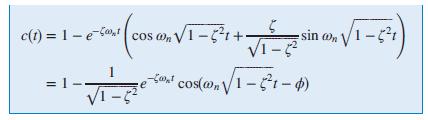
The system shown in Figure P4.6 has a unit step input. Find the output response as a function of time. Assume the system is underdamped. Notice that the result will be Eq. (4.28). Eq. (4.28): R(s) C(s) s2 + 2Çs + a FIGURE P4.6
Does the solution of the state equation yield the output response of the system? Explain.
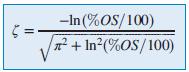
Derive the relationship for damping ratio as a function of percent overshoot, Eq. (4.39).Eq. (4.39): -In(%OS/100) +In2(%OS/100)
What is the relationship between (sI - A), which appeared during the Laplace transformation solution of the state equations, and the state transition matrix, which appeared during the classical solution of the state equation?
Calculate the exact response of each system of Problem 8 using Laplace transform techniques, and compare the results to those obtained in that problem.Data From Problem 8:For each of the transfer functions shown below, find the locations of the poles and zeros, plot them on the s-plane, and then
Name a major advantage of using time-domain techniques for the solution of the response.
Find the damping ratio and natural frequency for each second-order system of Problem 8 and show that the value of the damping ratio conforms to the type of response (underdamped, overdamped, and so on) predicted in that problem.Data From Problem 8:For each of the transfer functions shown below,
Name a major advantage of using frequency-domain techniques for the solution of the response.
A system has a damping ratio of 0.15, a natural frequency of 20 rad/s, and a dc gain of 1. Use inverse Laplace transforms to find an analytic expression of the response of the system to a unit-step input.
For each of the second-order systems that follow, find ζ; ωn; Ts; Tp; Tr , and %OS.+a.b.c. 16 T(s) = s2 + 3s + 16
Repeat Problem 20 using MATLAB. Have the computer program estimate the given specifications and plot the step responses. Estimate the rise time from the plots.Data from Problem 20:For each of the second-order systems that follow, find ζ; ωn; Ts; Tp; Tr , and %OS.+a.b.c. 16 T(s) = s2 + 3s + 16
Use MATLAB’s LTI Viewer and obtain settling time, peak time, rise time, and percent overshoot for each of the systems in Problem 20.Data From Problem 20:For each of the second-order systems that follow, find ζ; ωn; Ts; Tp; Tr , and %OS.+a.b.c. 16 T(s) = s2 + 3s + 16
For each pair of second-order system specifications that follow,find the location of the second-order pair of poles.a. %OS = 12%; Ts = 0:6 secondb. %OS = 10%; Tp = 5 secondsc. Ts = 7 seconds; Tp = 3 seconds
Find the transfer function of a second-order system that yields a 15% overshoot and a settling time of 0.7 second.
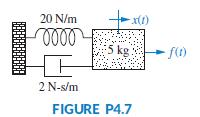
For the system shown in Figure P4.7, do the following:a. Find the transfer function G(s) = X(s)/F(s).b. Find ζ; ωn;%OS; Ts; Tp, Tr , and Cfinal for a unit-step input. 20 N/m x(1) 5 kg - f(t) 2 N-s/m FIGURE P4.7
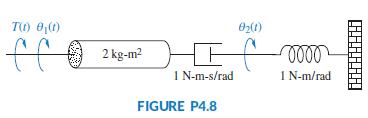
For the system shown in Figure P4.8, a step torque is applied at θ1(t). Find:a. The transfer function, G(s) = θ2(s)/T(s)b. The percent overshoot, settling time, and peak time for θ2(t). ff 2 kg-m2 I N-m-s/rad I N-m/rad FIGURE P4.8
The derivation of Eq. (4.42) to calculate the settling time for a second order system assumed an underdamped system (ζ < 1). In this problem you will calculate a similar result for a critically damped system (ζ = 1).a. Show that the unit-step response for a system with transfer function
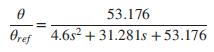
An autonomous robot to pick asparagus (Dong, 2011) capable of following planting rows has an orientation system with transfer functionMake a sketch of θ(t) in response to θref (t) = 3u(t). Indicate in your plot Cfinal; Cmax; Tp, and Ts. 53.176 Oref 4.6s2 + 31.281s +53.176
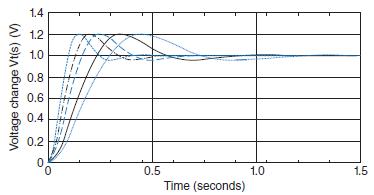
Figure P4.9 shows five step responses of an automatic voltage regulation system as one of the system parameters varies (Gozde, 2011). Assume for all five responses that they are those of a second order system with an overshoot of 20%. Make a sketch of the positions of the poles in the complex plane
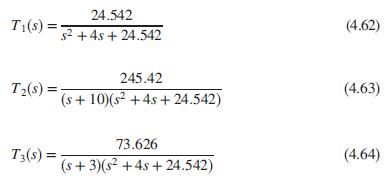
Derive the unit step response for each transfer function in Example 4.8.Data From Example 4.8:Find the step response of each of the transfer functions shown in Eqs. (4.62) through (4.64) and compare them. 24.542 T1(s) = (4.62) s2 +4s + 24.542 245.42 T2(s) = (4.63) (s+ 10)(s +4s + 24.542) 73.626
Find the percent overshoot, settling time, rise time, and peak time for 14.65 T(s) (s2 + 0.842s + 2.93)(s + 5)
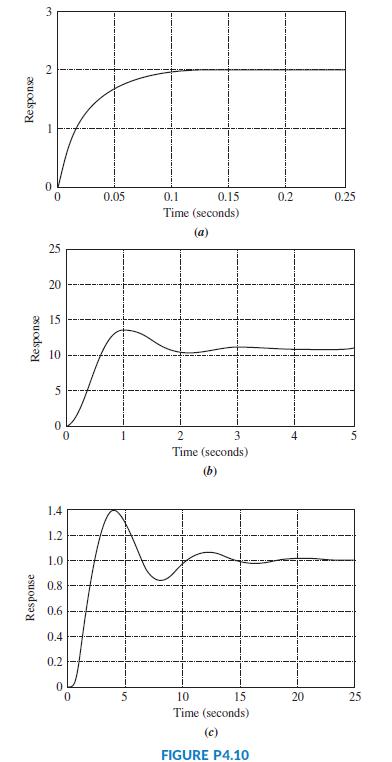
For each of the three unit step responses shown in Figure P4.10, find the transfer function of the system. 0.05 0.1 0.15 0.2 0.25 Time (seconds) (a) 25 20 15 10 2 3 5 Time (seconds) (b) 1.4 1.2 1.0 0.8 0.6 0.4 0.2 10 15 20 25 Time (seconds) (c) FIGURE P4.10 Response Response asuodsa 2.
Name the performance specification for first-order systems.
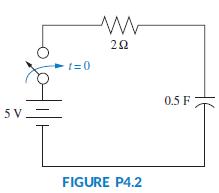
Plot the step response for Problem 4 using MATLAB. From your plots, find the time constant, rise time, and settling time.Data from Problem 4:Find the capacitor voltage in the network shown in Figure P4.2 if the switch closes at t = 0. Assume zero initial conditions. Also find the time constant,
The imaginary part of a pole generates what part of a response?
Find the capacitor voltage in the network shown in Figure P4.2 if the switch closes at t = 0. Assume zero initial conditions. Also find the time constant, rise time, and settling time for the capacitor voltage. 20 t=0 0.5 F 5 V . FIGURE P4.2
Showing 600 - 700
of 942
1
2
3
4
5
6
7
8
9
10
Step by Step Answers